Stingy Investor Search - Contact - Subscribe - Login
  Home | Articles | Links | SNW
 
Market uncertainty

The dawn of a new year gives birth to a plethora of predictions. Stock market prognostications are entertaining, but they should taken with a big grain of salt.

To see why, I begin with a moderately optimistic forecast for the S&P 500 which calls for 6-per-cent gains in 2013 after adjusting for inflation and including dividends. Six per cent happens to be a little below the index's average annual real return of 8.2 per cent since 1871 based on data from Professor Robert Shiller.

What are the odds the S&P 500 will gain close to 6 per cent in 2013? They are actually quite slim.

To see the range of possibilities it's useful to look at past returns, which are displayed in the accompanying graph. Each bar on the graph represents the number of years the S&P 500 achieved total returns, adjusted for inflation, closest to the various return targets.
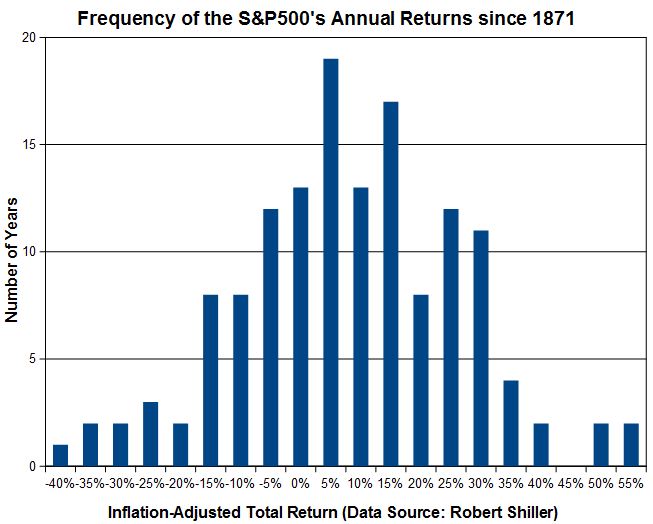
[larger version]


For instance, the height of the 5-per-cent return bar represents the number of years the S&P 500 gained between 2.5 per cent and 7.5 per cent.

Similarly, the 10-per-cent bar covers the 7.5 per cent to 12.5 per cent range.

As it happens, the most common return range is the one closest to 5 per cent, which was achieved on 19 occasions since 1871 or about 13.5 per cent of the time. As a result, it seems unlikely the index will gain 6 per cent next year. History shows much larger, or smaller, returns are far more probable.

Such wild swings are often ignored when discussing the long-term average results for the index. But the average is made up of a series which includes some giant moves. For instance, the index gained 53.2 per cent one year and it has lost 38.0 per cent in another. (The eagle-eyed will note these results aren't based on strict calendar year-end figures and are instead offset by a few weeks.)

Unfortunately, most stock market forecasts don't include an indication of the uncertainty of the forecast itself. Problem is, providing them would cast the forecast in a much different light.

To highlight the issue I'm going to add a plus, or minus, range to the 6-per-cent return prediction, which should be good 19 years out of 20. The approach should be recognizable by anyone who's familiar with the results of public opinion polls.

To do so, I simply go to the historical data and cut out the extremes at either end. It turns out the S&P 500 has provided real returns between minus 23 per cent and plus 35 per cent in 19 years out of 20. The range spans a whopping 58 percentage points centred on, as it happens, 6 per cent.

Putting it all together, S&P 500 is expected to generate real returns of 6 per cent plus or minus 29 percentage points next year, which should be good 19 times out of 20. The other one time ought to result in much larger gains or losses.

Problem is, this prediction isn't particularly useful for planning purposes. But the stock market tends to be a unpredictable place and wanting it to be otherwise doesn't make it so.

Even worse, I've likely underestimated the level of uncertainty involved because the uncertainty range is based on a relatively short - statistically speaking - historical record. It is entirely possible 2013 will prove to be a record-breaker.

As a result, when you're next faced with a stock market prediction, focus on the uncertainties involved just as much as the expected returns. You may discover the prediction isn't really much of a prediction at all.

First published in the Globe and Mail, January 2 2013.

 
Globe & Mail Articles
 Portfolios

 Dividend All-Stars for 2024
 250 Megastars for 2024
 Extreme yields
 The easy way
 Smaller stable dividend
 250 Megastars for 2023
 Champagne portfolio
 Screaming Value
 Blended momentum
 Dividend monster
 Frugal dividend
 Stable dividend
 Speads and recessions
 TSX 60 for value investors
 Looking at 10-year returns
 Watching for a bottom
 Oh, bother!
 Low P/E DJIA
 Indexing advice
 Media-shy stocks
 Curse of size
 Market uncertainty
 Be even lazier
 Scary beats safe
 Small, illiquid, value
 Use the numbers
 What value is good value?
 Sculpt for value
 Value vs CAPE
 Graham Rules
 CAPE vs PeakE
 Top value ratio
 Low Beta
 Value and dividends
 Walter Schloss
 Try unloved AIG
 Why I'm a value investor
 New world of ETFs
 Low P/Es possible
 10 yielders
 Be happier
 Long-Short
 Dividend Downside
 Shiller's P/E
 Copycat investing
 Cashing in on class
 Index roulette
 Theory collides
 Diving too deep
 3 retirement villains
 Scourge of inflation
 Economic omens
 Analyst Expectations
 Value stock scarcity
 It's all in the index
 How to pick good funds
 Low Beta Wins
 Hunt for dividend stocks
 Think garage sale

MoneySaver Articles
 2 Graham Stocks for 2018
 2 Stingy Stocks for 2017
 2 Graham Stocks for 2017
 3 Stingy Stocks for 2016
 5 Graham Stocks for 2016
 3 Stingy Stocks for 2015
 3 Graham Stocks for 2015
 3 Stingy Stocks for 2014
 4 Graham Stocks for 2014
 8 Stingy Stocks for 2013
 6 Graham Stocks for 2013
 9 Stingy Stocks for 2012
 8 Graham Stocks for 2012
 Simple Way 2011
 5 Stingy Stocks for 2011
 7 Graham Stocks for 2011
 Simple Way 2010
 5 Stingy Stocks for 2010
 8 Graham Stocks for 2010
 Simple Way 2009
 Timing Temptation
 19 Stingy Stocks for 2009
 4 Graham Stocks for 2009
 Simple Way 2008
 Active at Passive Prices
 Unbundling ETFs 2008
 5 Stingy Stocks for 2008
 5 Graham Stocks for 2008
 Is your index too active?
 Graham's Simple Way
 Canadian Graham Stocks
 5 Stingy Stocks for 2007
 8 Graham Stocks for 2007
 Top SPPs
 The Simple Way
 A hole in your IPO?
 Monkey Business
 8 Stingy Stocks for 2006
 Graham Stock Gainers
 Blue-Chip Blues
 Are Dividends Safe?
 SPPs for 2005
 Graham's Simplest Way
 Selling Graham Stocks
 RRSP Money Market Funds
 Stingy Stocks for 2005
 High Performance Graham
 Intelligent Indexing
 Unbundling Canadian ETFs
 A history of yield
 A Dynamic Duo
 Canadian Graham Stock
 Dividends at Risk
 Thrifty Value Stocks
 Stocks in Short Supply
 The New Dividend
 Hunting Goodwill
 SPPs for 2003
 RRSP: don't panic
 Desirable Dividends
 Stingy Selections 2003
 10 Graham Picks
 Growth Eh?
 Timing Disaster
 Dangerous Diversification
 The Coffee Can Portfolio
 Down with the dogs
 Stingy Selections
 Frugal Funds
 Graham Revisited
 Just Spend It
 Ticker Temptation
 Stock Mortality
 Focus on Fees
 SPPs for the Long Term
 Seeking Solid Stocks
 Relative Strength
 The VR Approach
 The Irrational Investor
 Value Investing

Old MS Articles
 Cdn Top 200 2018
 Cdn Top 200 2017
 Cdn Top 200 2016
 Cdn Top 200 2015
 Cdn Top 200 2014
 Cdn Top 200 2013
 Cdn Top 200 2012
 Cdn Top 200 2011
 Cdn Top 200 2010
 Cdn Top 200 2009
 Cdn Top 200 2008
 Cdn Top 200 2007
 Cdn Top 200 2006
 Cdn Top 200 2005
 US Top 500 2018
 US Top 500 2017
 US Top 500 2016
 US Top 500 2015
 US Top 500 2014
 US Top 500 2013
 US Top 500 2012
 US Top 500 2011
 US Top 500 2010
 US Top 500 2009
 US Top 500 2008
 US Top 500 2007
 US Top 1000 2006
 Dividends 100 2017
 Dividends 100 2016
 Retirement 100 2015
 Retirement 100 2014
 Retirement 100 2013
 Retirement 100 2012
 Retirement 100 2011
 Retirement 100 2010
 Income 100 2009
 Income 100 2008
 Income 100 2007
 Top Trusts 2006
 Top Trusts 2005
 Hot Potato
 Buffett Buys
 FB IPO
 Stocks that pay
 Value in the S&P500
 Where to invest $100k
 Where to invest $10k
 Summer Simple Way
 A crystal ball for stocks?
 Cheap & safe
 Risky business
 Dividend investing
 Value investing
 Momentum investing
 Low P/E P/B
 Dividends
 Dividend growers
 Graham's prescription
 The case for optimism
 Wicked investments
 Simply spectacular
 Small stocks, big profits
 Value that sizzles
 So simple it works
 No assembly required
 Investing by the book
 Invest like the masters
 A simple way to get rich
 Stocks for cannibals
 Car bites dogs
 So easy, so profitable
 Dogs of the Dow
 Money for nothing
 Yield of dreams
 Return of the master

Advisor's Edge Articles
 Passive Rebundling
 Doing the math

Flip Books


About Us | Legal | Contact Us
Disclaimers: Consult with a qualified investment adviser before trading. Past performance is a poor indicator of future performance. The information on this site, and in its related newsletters, is not intended to be, nor does it constitute, financial advice or recommendations. The information on this site is in no way guaranteed for completeness, accuracy or in any other way. More...