|
|||||||||||||||||||||||||||
|
|||||||||||||||||||||||||||
|
The Top 200 Canadian Stocks for 2013 Good stocks are hard to find because the market is filled with a plethora of choices. It's difficult to know where to start. That's why we're pleased to present you with the ninth annual MoneySense Top 200 guide to Canadian stocks, which provides a helping hand. It directs you through the markets to some of the most compelling stocks Canada has on offer. We're happy to report our modest efforts have yielded excellent results so far. Last year our All-Star stocks, which meld the best growth and value characteristics, shot up an average of 13.4%. Meanwhile the Canadian market, as tracked by the iShares S&P TSX Capped Composite Index (XIC), lagged with gains of 3.8% since our last update. (The period was from Oct. 19, 2011 to Oct. 25, 2012. Figures don't include dividends.) Short-term results are one thing but the All-Stars really shine over the long haul. If you had bought equal amounts of the All-Stars and rolled your gains into the new stocks each year, you'd have enjoyed 15.2% average annual returns over the last eight years. By way of comparison, the S&P/TSX Composite Index climbed just 4.5% a year over the same period. The All-Stars outperformed by an average of 10.7 percentage points a year. As you might imagine, we're highly satisfied with our performance record. Take a look at "Growth of the Top 200 All-Stars," which translates the percentages into more easily understandable dollar terms. If you had split $100,000 equally among the original All-Stars eight years ago, then sold them and rolled your gains into thenewbatch each year, your portfolio would now be worth approximately $310,000 - more than triple your original investment. Again, that doesn't include dividends, which would have provided an extra boost over the period. 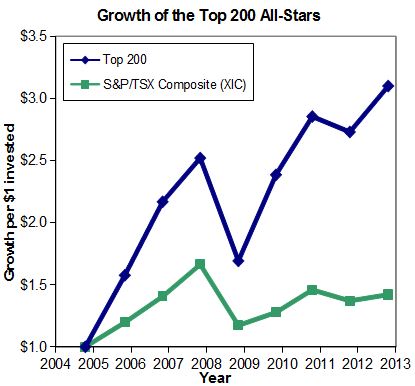 It's important to emphasize that while we knocked the ball out of the park over the last eight years, stock picking comes with risk and uncertainty. Our method slightly underperformed the market twice in the last eight years and we fully expect to encounter soft periods again in the future. Furthermore, some individual stocks inevitably perform poorly. We hope others will more than make up the difference but this isn't always the case. As a result, it's important to know what you're getting into. (If you're just starting your stock-picking adventure, we suggest reading The MoneySense Guide to Investing in Stocks, now available on newsstands or online at www.moneysense.ca/books. It clarifies the basics and addresses more advanced topics.) Nonetheless, we hope our track record will spark your interest in this year's Top 200. As in prior years, we scrutinized the 200 largest public companies in Canada and graded each based on its investment merits. On pages 38 to 45, we provide an easy-to-use scorecard crammed full of the sort of data that should appeal to most investors. We like to think the Top 200 delivers a more objective and well-rounded take on large Canadian stocks than you'll find from any other single source. The Top 200 also offers a logical, consistent approach to uncovering the best stocks. Much like the hard-nosed Ebenezer Scrooge, our method isn't swayed by feelings, fads, or fancies. Nor do we rely on gut instincts or joyful expectations of what the future might bring. Instead, we focus only on the numbers. Our personal opinions about a company don't enter into it. We begin with the largest 200 companies in Canada based on revenue, using data from Bloomberg. We then grade each stock to see if it's worth investing in. We first measure its appeal as a growth investment, then its merit as a value play. (Growth investors like firms with growing sales and earnings, whereas value investors prefer cheap stocks that pay nice dividends.) Our growth and value tests are founded on the sort of complex calculations professionals use, but in the end we reduce everything about a stock to two simple grades: one for its growth potential and one that measures its value appeal. The grades work just like they did back when you were in school. Top stocks are awarded As. Solid firms get by with Bs or Cs. Those lacking the best qualities are sent home with a D or even an F. We are naturally attracted to stocks with good grades and would have serious second thoughts about those at the bottom of the barrel. To make it to the very top of the class and into the All-Star list, a stock must manage to achieve at least one A and one B on the value and the growth tests. Only eight stocks made it into this select group this year. But before we discuss the new All-Stars, here's the low-down on how we went about grading each stock. Grading for Growth It's only natural for growth investors to like companies with good growth records over the last few years. As a result, we begin by awarding marks to firms with solid earningsper- share and sales-per-share growth over the last three years. We also track each firm's growth in total assets over the last year to make sure it is expanding organically and not overextending itself. As great as growth is, we also want to be sure a company is getting good value from its resources. That's why we scrutinize each stock's return on equity. This statistic measures how much a firm is earning compared to the amount shareholders have invested. It's an important indicator of business quality and we give high marks to stocks with healthy returns on equity compared to others in their industry. We also like to see how the market measures a company's recent progress. As a result, we give higher marks to stocks that have been strong performers relative to other stocks. In particular, we favour those that show momentum with solid total returns over the past year. Finally, we weigh each stock's price-to-sales ratio, which measures a stock's price in comparison to its sales. Low to moderate price-to-sales ratios indicate stocks that are reasonably priced and we award them extra marks. In contrast, firms with sky high price-to-sales ratios are often far too glamorous for our taste. Much like meals at fabulously expensive restaurants, they often disappoint. Combining these growth factors, we arrive at a final growth grade. Only 20 out of 200 stocks earned an A this year.
Evaluating Value Value investors love bargains and seek firms selling at low prices compared to various measures of financial merit. We begin by looking for stocks with low price-to-book-value ratios (P/B). That's a number that compares the market value of a company to how much money you could raise by selling off a company's assets (at their balance-sheet values) and paying off its debts. Low-P/B ratios provide an indicator that you're not paying too much more for a stock than its parts are worth. To get top marks for value, a stock must possess a low price-to-book-value ratio compared to the overall market and to its competitors in the same industry. We also like to track price-to-tangible-book-value ratios. Tangible book value is like regular book value, but ignores any intangible assets (such as goodwill) that a firm may have. It's an even more rigorous estimate of how much a company would be worth to a Scrooge-like investor intent on closing it down and selling it for scrap. But other factors matter, too. Good companies produce profits, so we award higher scores to firms with positive price-to-earnings ratios (this backward-looking figure is known as the trailing 12-month P/E ratio). We also prefer it when industry analysts expect a company to be profitable and have a positive P/E over the next year (this number is known as the forward P/E ratio). It's also important to stick to stocks that pay dividends. Not only do they provide nice income streams that can be used to fund lavish holiday feasts, but dividend paying companies have a history of outperforming miserly firms that keep all the money to themselves. Low prices are one thing but it's useful to be on the lookout for firms on a spending spree that have loaded up on debt. We penalize companies living the high life on credit and instead award marks to firms with low leverage ratios (defined as the ratio of assets to stockholders' equity) compared to their peers. After melding all these factors into a value grade, we found only 20 stocks worthy of taking home an A this year.
All-Star Stocks As mentioned previously, only eight stocks earned at least one A and one B on our value and growth tests, which makes them All-Stars. They represent the most interesting stocks this year. We are pleased to see two of last year's All-Stars make the list again this year. The returning veterans are E-L Financial (ELF) and Industrial Alliance Insurance (IAG). New additions are: Indigo Books & Music (IDG), Magna International (MG), Methanex (MX), Newalta (NAL), Power Corporation of Canada(POW) and Winpak (WPK).
Special congratulations go out to E-L Financial and Power Corp for managing to achieve the coveted double-A rating this year. They earned both an A for value and an A for growth. Both firms happen to be large insurance-based financial conglomerates. Power Corp owns a big stake in Power Financial (PWF), which in turn owns large portions of Great-West Lifeco (GWO), IGM Financial (IGM) and other firms. E-L Financial is a smaller entity that owns The Dominion and Empire Life. It also has stakes in publicly traded Algoma Central (ALC), Economic Investment Trust (EVT), and United Corporations (UNC). Before rushing to buy any stock, do your due diligence. Check that its situation hasn't changed in some important way. Keep an eye out for stocks that trade infrequently; care should be taken when dealing with less liquid securities, which can cost more to buy and sell and might be best avoided by novice investors. Read the latest press releases and regulatory filings. Scan news stories for breaking developments. Take these steps and you'll be more comfortable with your investments, increasing the probability you'll enjoy a very merry holiday next year. First published in the December/January 2013 edition of MoneySense magazine. Added:
|
|||||||||||||||||||||||||||
| |||||||||||||||||||||||||||
| Disclaimers: Consult with a qualified investment adviser before trading. Past performance is a poor indicator of future performance. The information on this site, and in its related newsletters, is not intended to be, nor does it constitute, financial advice or recommendations. The information on this site is in no way guaranteed for completeness, accuracy or in any other way. More... | |||||||||||||||||||||||||||