|
|||||||||||||||||||||||||
|
|||||||||||||||||||||||||
|
The Top 200 Canadian Stocks for 2012 Walking downstairs on Christmas day was a ceremonial affair when I was young. It started by lining up with my brother to descend to the living room in order from eldest to youngest. Aside from heightening the anticipation of good things to come, it allowed my parents to see our reactions to the Christmas tree, fire, presents, and perhaps most delightfully, the stockings stuffed to the brim with treats. The felling of delight I had when pawing through my treat-laden stocking is now, alas, a thing of the past. But these days I get the same sort of excitement when I look through the largest stocks in Canada for this year's MoneySense's Top 200 All-Stars. This year marks the eighth in a row for the Top 200 tradition which, I'm pleased to say, has been very fruitful. It also happens to be another year in which the Top 200 All-Stars have managed to outperform the market. If you had bought equal amounts of the All-Stars and rolled your gains into the new stocks each year, you'd now be sitting on a 15.5% average annual return over the last seven years, not including dividends. By way of comparison, that's almost 11 percentage points higher than the annual return of the S&P/TSX Composite (XIC), which climbed 4.6% a year over the same period. While we outperformed this year, the recent market distress depressed our absolute returns. The Top 200 All-Stars lost 4.2% since last year while the S&P/TSX Composite (XIC) declined 5.9%. So, while we outperformed by 1.7 percentage points this year, the overall result felt something like getting an off-colour sweater from Grandma for Christmas. It wasn't really what we wanted. Despite the soft year, our long-term record remains robust. Last year we found that our All-Stars bested every single Canadian equity fund over the prior five years and we were compelled to peek at the numbers again. When we did, we discovered that over the last five years, our All-Stars have beaten more than 95% of Canadian equity funds (in either the pure or focused categories). The S&P/TSX Composite, meanwhile, trailed the returns of the All-Stars by more than 5 percentage points annually. To be fair, the comparison isn't completely precise. For instance, the performance period in question doesn't match exactly. It's off by several days because we don't package up our All-Stars at exactly the same time each year. Also, we haven't included trading commissions which, although low these days, vary from investor to investor. On the other hand, our gains don't include dividends - whereas active-fund returns do - so we don't think we're being too unfair to the funds. We're pleased as punch with our performance record. As you can see in graphs below, if you had split $100,000 equally among our original All-Stars seven years ago, then sold them and rolled your gains into the new batch each year, your portfolio would now be worth $273,000 - almost triple your original investment. (Again, not including dividends.) Still, we want to stress that while we've done very well over the last seven years, those kinds of gains don't come without risk. It's almost inevitable that we will run into a soft patch. While we believe that our stock picking methodology should work well over the long term, we know - and you should too - that we can't predict the future. This year's All-Stars could disappoint. 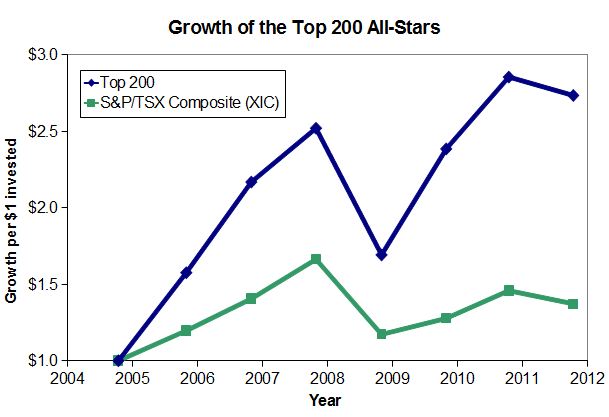 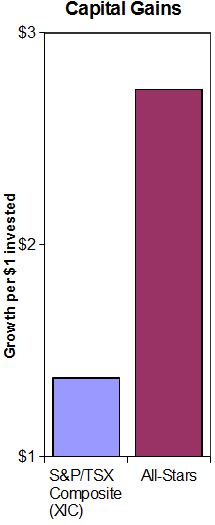
Nonetheless, we hope our track record will whet your appetite for this year's Top 200. As in prior years, we sized up each of Canada's 200 largest companies and graded each one on its investment merit. We deliver an easy-to-use scorecard festooned with just the sort of information that appeals to most investors. In fact, we think the Top 200 gives you a more objective guide to large Canadian stocks than you're likely to find from any other single source. Importantly, the Top 200 offers a logical and consistent approach to selecting stocks that isn't influenced by feelings or fleeting fads. Instead we take a tip from Mr. Scrooge and apply hard-headed reasoning. We do not rely on gut instincts or nog-induced visions of the future. Our results are based purely on the numbers. Our opinions about a company don't enter into it. We begin by identifying the largest 200 companies in Canada by revenue. Using Bloomberg data, we evaluate each stock, first for its attractiveness as a value investment and then on its appeal as a growth investment. (Value investors like profitable stocks that trade at low multiples of book value and pay juicy dividends. Growth investors like companies with expanding earnings and sales.) Our value and growth tests are driven by sophisticated calculations, but in the end we reduce everything about a stock to two grades: one for its value appeal, one for its growth potential. The grades work just like they did back when you were in school. The best are awarded an A. Solid firms get by with a B or a C. Those in need of improvement go home with a D or even an F. A select group of stocks - those that manage to achieve at least one A and one B on the value and the growth tests - make our All-Star list. Only 9 stocks got the honour this year. But before we talk about the new All-Stars, here's how we rate all 200 stocks. The value test Value investors like solid stocks selling at low prices, so we begin by looking for those with low price-to-book-value ratios (P/B). This number compares the market value of a company to how much cash you could raise by selling off the company's assets (at balance-sheet prices) and paying off the firm's debts. Low P/B ratios provide some assurance that you're not paying much more for a stock than its parts are worth. To get top value marks, a stock has to possess a low price-to-book-value ratio compared to the market and also compared to its competitors within the same industry. We also like to track price-to-tangible-book-value ratios. Tangible book value is like regular book value, but it ignores any intangible assets (such as goodwill, which reflects the value of a well-loved brand name or key patents) that a firm may have. It's an even sterner test of how much a company would be worth if Scrooge had to close it down and sell it for scrap. Other factors matter, too. Good companies produce profits, so we award higher scores to firms that have positive price-to-earnings ratios (this backward-looking figure is known as the trailing 12-month P/E ratio). We also reward a company if industry analysts expect it to be profitable and have a positive P/E over the next year (this number is known as the forward P/E ratio). Because we like our investments to pay, we award extra marks to dividend-generating stocks. Stocks that send investors the modern equivalent of gold coins - and not the yummy chocolate type - tend to outperform. To ensure a company won't flounder from excessive debt after a holiday binge, we penalise companies living on credit. We award the best grades to firms with low leverage ratios (defined as the ratio of assets to stockholder's equity) compared to their peers. Finally, we combine these factors into a single value grade. Only 20 stocks got an A this year.
The growth test The first mark of a good growth stock is, not surprisingly, growth. We start by awarding high marks to any stock that achieved good earnings-per-share and sales-per-share growth over the past three years. We also track each firm's growth in total assets since last year to get a sense of recent trends. We want to be sure that the market is taking note of a company's improving situation, so we hand out additional marks to stocks that are strong performers relative to other stocks. In particular, we favour stocks that have provided solid total returns over the past year. As great as growth is, we hedge our bets by checking out each stock's return on equity. This statistic measures how much a firm is earning compared to the amount that shareholders have invested. It is a key indicator of the quality of a business. Only those stocks with healthy returns on equity compared to others in their industry get top marks. Finally, since no one wants be the last buyer in a bubble, we examine each stock's price-to-sales ratio. This ratio measures the stock's price in comparison to the company's sales. Low to moderate price-to-sales ratios indicate stocks that are reasonably priced and we award them extra marks. In contrast, firms with high price-to-sales ratios may be glamour stocks that could disappoint. Putting these growth and quality indicators together, we arrive at a final growth grade. Only 20 out of 200 stocks earned an A this year.
This year's All-Star stocks As we mentioned previously, only 9 stocks earned at least one A and one B on our value and growth tests. We are pleased to see four of last year's All-Stars make the list again this year. The veterans are: Alimentation Couche-Tard (ATD.B), ATCO (ACO.X), Domtar (UFS), and Magellan Aerospace (MAL). The new additions are: CCL Industries (CCL.B), E-L Financial (ELF), Empire (EMP.A), Industrial Alliance (IAG), and Uni-Select (UNS).
The two stocks that picked up top grades for both value and growth are E-L Financial and Uni-Select. E-L Financial is a large insurance conglomerate and investment company. It also owns just over 25% of Algoma Central, which primarily runs ships on the Great Lakes. Quebec-based Uni-Select (UNS) is the leading auto-parts distributor in Canada and is rapidly expanding in the United States. Alimentation Couche-Tard runs nearly 5,800 convenience stores across Canada and the U.S. under three main banners: Couche-Tard, Mac's, and Circle K. It is also this year's largest All-Star by revenue. ATCO is a sprawling utility and energy conglomerate that hails from Alberta. I've followed the firm for years and have come to appreciate its strong record of dividend growth. Domtar, a Fortune 500 pulp and paper firm, nosed its way into the list because it trades on the TSX and has significant operations in both the U.S. and Canada. But patriots should note that it is officially domiciled in the United States. Empire owns Sobeys and focuses on food-retailing and related real estate holdings. Empire is the second largest All-Star this year and sports a very strong growth record over the last decade. Industrial Alliance is the fourth largest life and health insurance company in Canada. Impressively, it has almost tripled its book value per share over the last decade and has a good dividend growth record. CCL Industries is a specialty packaging company focusing on the home & personal care, food & beverage, and healthcare markets. In recent years the firm has been reducing its share count and increasing its dividend which tends to be a mighty fine combination. Magellan makes parts for the aerospace industry. But it comes with a big side order of risk because it is quite a small stock (by market capitalisation). In addition, some of its debentures are likely to be converted into stock at the end of April 2012 which should boost the firm's share count considerably. Before you rush out to buy any stock, do your own due diligence. Make sure that its situation hasn't changed in some important way. Keep an eye out for stocks that trade infrequently - they deserve care. Read each firm's latest press releases and regulatory filings. Scan newspaper stories to make sure you're aware of important developments and breaking news. If you do, you'll be more comfortable with your stocks which increases the probability that Santa will be nice to you next year. First published in the December/January 2012 edition of MoneySense magazine. Added:
|
|||||||||||||||||||||||||
| |||||||||||||||||||||||||
| Disclaimers: Consult with a qualified investment adviser before trading. Past performance is a poor indicator of future performance. The information on this site, and in its related newsletters, is not intended to be, nor does it constitute, financial advice or recommendations. The information on this site is in no way guaranteed for completeness, accuracy or in any other way. More... | |||||||||||||||||||||||||