Stingy Investor Search - Contact - Subscribe - Login
  Home | Articles | Links | SNW
 
3 villains can steal your retirement dreams

Building a strong financial castle to fund your retirement is hard. If you're not careful, you may discover a hole in your vault and three villains sneaking off with the family jewels.

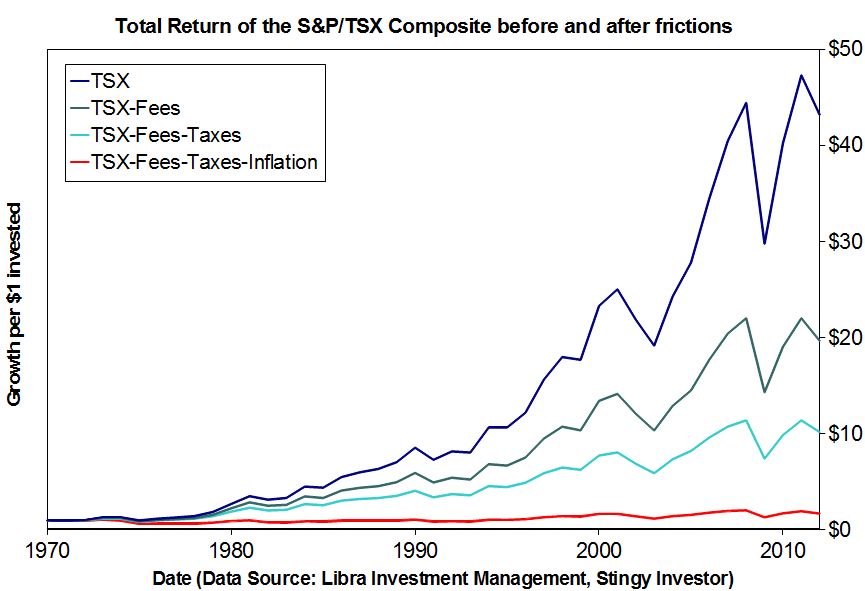
To see these predators in action, let's begin by considering a portfolio that follows the total return of the S&P/TSX Composite index as shown in the following graph. The index has performed well since 1970 with an average annual return of 9.4 per cent.

Graph of the returns of the S&P/TSX Composite after fees, taxes, and inflation
[larger version]


But these happy returns don't factor in the annual fees charged by funds. These typically range between 2 per cent and 2.5 per cent for Canadian stock funds and are called management expense ratios (MERs).

Problem is, funds - on average - have a hard time beating the index's returns before fees. They tend to trail badly after fees. Indeed, there are theoretical reasons to think that funds, as a group, merely yield index returns less the fees they charge.

The fee line on the graph is based on the uncharitable view that funds achieve index returns minus a 2 per cent annual fee. Over the period, those seemingly small charges reduce the size of the ending portfolio by more than 50 per cent. Such is the misery of compounded fees.

Fund fees are one thing but the crown also likes to extract a pound of flesh. The third line on the graph - the one just under the fee line - represents the returns of the index after the 2 per cent fund fee and a 23 per cent tax on gains from the prior peak levied annually.

The point here isn't one of precision - after all, different investors are subject to different tax burdens - but to highlight why proper tax planning is important. Stingy investors want to legally reduce taxes and fees, all else being equal.

Inflation is the third sapper of wealth and the last line on the graph shows the combined impact of 2 per cent annual fees, 23 per cent annual taxes on gains, and inflation.

The result? The 9.4 per cent starting annual return for the index is reduced to a mere 1.3 per cent after fees, taxes, and inflation are taken into account. Put in dollar terms, instead of growing each dollar invested to $43.20 over the period, you'd only be left with $1.70 after fees, taxes, and inflation.

But you can foil two of the villains. Fund fees can be reduced by favouring low-fee active funds or lower-fee index funds and exchange-traded funds. On the tax front, you can save via TFSAs or defer taxes by using RRSPs or opting for longer holding periods.

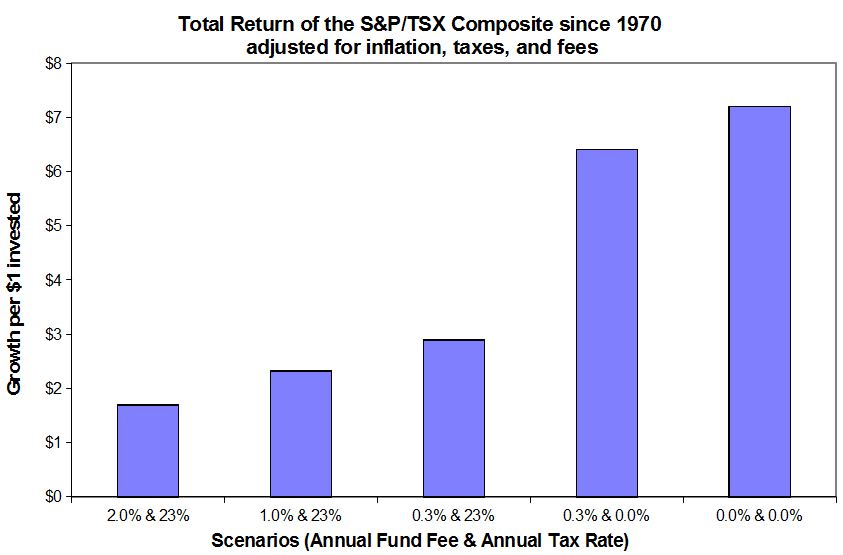
The bar chart shows several different low-fee and low-tax scenarios. For instance, a 0.3 per cent annual fund fee and a zero tax rate would have put $6.40 in your pocket, adjusted for inflation, per dollar invested. That's a darn sight better than $1.70.

The impact of various fees and taxes on the real returns of the S&P/TSX Composite
[larger version]


The moral of the story? Be sure to keep a close eye on fees and taxes. If you don't, a pack of villains might run off with the bulk of your retirement portfolio.

First published in the Globe and Mail, January 28 2012.

 
Globe & Mail Articles
 Portfolios

 Dividend All-Stars for 2024
 250 Megastars for 2024
 Extreme yields
 The easy way
 Smaller stable dividend
 250 Megastars for 2023
 Champagne portfolio
 Screaming Value
 Blended momentum
 Dividend monster
 Frugal dividend
 Stable dividend
 Speads and recessions
 TSX 60 for value investors
 Looking at 10-year returns
 Watching for a bottom
 Oh, bother!
 Low P/E DJIA
 Indexing advice
 Media-shy stocks
 Curse of size
 Market uncertainty
 Be even lazier
 Scary beats safe
 Small, illiquid, value
 Use the numbers
 What value is good value?
 Sculpt for value
 Value vs CAPE
 Graham Rules
 CAPE vs PeakE
 Top value ratio
 Low Beta
 Value and dividends
 Walter Schloss
 Try unloved AIG
 Why I'm a value investor
 New world of ETFs
 Low P/Es possible
 10 yielders
 Be happier
 Long-Short
 Dividend Downside
 Shiller's P/E
 Copycat investing
 Cashing in on class
 Index roulette
 Theory collides
 Diving too deep
 3 retirement villains
 Scourge of inflation
 Economic omens
 Analyst Expectations
 Value stock scarcity
 It's all in the index
 How to pick good funds
 Low Beta Wins
 Hunt for dividend stocks
 Think garage sale

MoneySaver Articles
 2 Graham Stocks for 2018
 2 Stingy Stocks for 2017
 2 Graham Stocks for 2017
 3 Stingy Stocks for 2016
 5 Graham Stocks for 2016
 3 Stingy Stocks for 2015
 3 Graham Stocks for 2015
 3 Stingy Stocks for 2014
 4 Graham Stocks for 2014
 8 Stingy Stocks for 2013
 6 Graham Stocks for 2013
 9 Stingy Stocks for 2012
 8 Graham Stocks for 2012
 Simple Way 2011
 5 Stingy Stocks for 2011
 7 Graham Stocks for 2011
 Simple Way 2010
 5 Stingy Stocks for 2010
 8 Graham Stocks for 2010
 Simple Way 2009
 Timing Temptation
 19 Stingy Stocks for 2009
 4 Graham Stocks for 2009
 Simple Way 2008
 Active at Passive Prices
 Unbundling ETFs 2008
 5 Stingy Stocks for 2008
 5 Graham Stocks for 2008
 Is your index too active?
 Graham's Simple Way
 Canadian Graham Stocks
 5 Stingy Stocks for 2007
 8 Graham Stocks for 2007
 Top SPPs
 The Simple Way
 A hole in your IPO?
 Monkey Business
 8 Stingy Stocks for 2006
 Graham Stock Gainers
 Blue-Chip Blues
 Are Dividends Safe?
 SPPs for 2005
 Graham's Simplest Way
 Selling Graham Stocks
 RRSP Money Market Funds
 Stingy Stocks for 2005
 High Performance Graham
 Intelligent Indexing
 Unbundling Canadian ETFs
 A history of yield
 A Dynamic Duo
 Canadian Graham Stock
 Dividends at Risk
 Thrifty Value Stocks
 Stocks in Short Supply
 The New Dividend
 Hunting Goodwill
 SPPs for 2003
 RRSP: don't panic
 Desirable Dividends
 Stingy Selections 2003
 10 Graham Picks
 Growth Eh?
 Timing Disaster
 Dangerous Diversification
 The Coffee Can Portfolio
 Down with the dogs
 Stingy Selections
 Frugal Funds
 Graham Revisited
 Just Spend It
 Ticker Temptation
 Stock Mortality
 Focus on Fees
 SPPs for the Long Term
 Seeking Solid Stocks
 Relative Strength
 The VR Approach
 The Irrational Investor
 Value Investing

Old MS Articles
 Cdn Top 200 2018
 Cdn Top 200 2017
 Cdn Top 200 2016
 Cdn Top 200 2015
 Cdn Top 200 2014
 Cdn Top 200 2013
 Cdn Top 200 2012
 Cdn Top 200 2011
 Cdn Top 200 2010
 Cdn Top 200 2009
 Cdn Top 200 2008
 Cdn Top 200 2007
 Cdn Top 200 2006
 Cdn Top 200 2005
 US Top 500 2018
 US Top 500 2017
 US Top 500 2016
 US Top 500 2015
 US Top 500 2014
 US Top 500 2013
 US Top 500 2012
 US Top 500 2011
 US Top 500 2010
 US Top 500 2009
 US Top 500 2008
 US Top 500 2007
 US Top 1000 2006
 Dividends 100 2017
 Dividends 100 2016
 Retirement 100 2015
 Retirement 100 2014
 Retirement 100 2013
 Retirement 100 2012
 Retirement 100 2011
 Retirement 100 2010
 Income 100 2009
 Income 100 2008
 Income 100 2007
 Top Trusts 2006
 Top Trusts 2005
 Hot Potato
 Buffett Buys
 FB IPO
 Stocks that pay
 Value in the S&P500
 Where to invest $100k
 Where to invest $10k
 Summer Simple Way
 A crystal ball for stocks?
 Cheap & safe
 Risky business
 Dividend investing
 Value investing
 Momentum investing
 Low P/E P/B
 Dividends
 Dividend growers
 Graham's prescription
 The case for optimism
 Wicked investments
 Simply spectacular
 Small stocks, big profits
 Value that sizzles
 So simple it works
 No assembly required
 Investing by the book
 Invest like the masters
 A simple way to get rich
 Stocks for cannibals
 Car bites dogs
 So easy, so profitable
 Dogs of the Dow
 Money for nothing
 Yield of dreams
 Return of the master

Advisor's Edge Articles
 Passive Rebundling
 Doing the math

Flip Books


About Us | Legal | Contact Us
Disclaimers: Consult with a qualified investment adviser before trading. Past performance is a poor indicator of future performance. The information on this site, and in its related newsletters, is not intended to be, nor does it constitute, financial advice or recommendations. The information on this site is in no way guaranteed for completeness, accuracy or in any other way. More...