|
|||||
|
|||||
|
Risky business "Igor! My portfolio needs a boost. Fetch me some high risk stocks", declared Frankenstein. You see, the Doc was in a pickle. Castle costs were way up and heating the drafty halls was just the beginning. His once friendly contractors rebelled and started to demand danger pay to fix the lightning machines. To make matters worse, the price of brains was getting, well, ridiculous. But his financial advisor had a solution. The Doctor could fund his exciting experiments by dialling up the risk level on his portfolio and thereby restore his treasury. While you probably don't have a moat to tend, you're likely familiar with the link between risk and returns. In fact, to many it is the most important rule in investing: The more risk you take, the higher your potential returns. But what if it isn't true? What if, in fact, after a certain point, taking on more risk actually lowers your returns? It's a controversial argument that seems to directly contradict the teachings of investing 101 - but after spending many years carefully considering empirical studies on the matter, it's an argument that I believe to be true. And just to be clear: I'm not saying that you should avoid risk because you could lose your money. That's practically the definition of risk. What I'm saying is that historical evidence shows that above a certain point, the more risk you take on, the lower your potential returns. The trouble with measuring risk Before I defend that position, let's back up a bit and look at how risk is commonly defined. After all, risk is a malleable term that can cover a wide variety of circumstances and meanings. The word 'risk' is very often misused - and even more often misunderstood. To most investors, risk is related to the chance of losing money and to the size of potential losses. But even here risk is already a complicated multi-factor beast. Worse, it's easy to dream up all sorts of potential dangers from the fanciful to the everyday. For instance, you're not going to worry much about the possibility that your company's factory will be destroyed by a giant block of falling cheese. On the other hand, smaller frequent losses like those due to shoplifting are an important concern for retailers. What we need is a way to sum up all the risks that might cause a stock's price to fall. And indeed some academics gave producing such a measure the old college try. Most famous is the late 20th century's classic definition of risk which is encapsulated in a strange concept called 'beta'. Beta is a risk measure that puts a number on the tendency of stocks to move in sync with the markets. It is related to a combination of how volatile a stock is (or how much its returns vary) and how closely it moves (or is correlated) with the market as a whole. Both factors are important. Roughly speaking, stocks with a beta of 1 tend to move in sync with the market. Those with a beta of 0 tend to move independently of the market, while stocks with negative betas tend to zig when the market zags. (By definition the overall market has a beta of 1.) Thus, a stock that jumps around a lot (highly volatile) and moves in tandem with the market will have a high positive beta and is considered risky. While a placid stock that doesn't move much and doesn't seem to be impacted much by the market will have a small beta and is considered to be less risky. But keep in mind, beta is based on stock returns (think percentage moves) and not prices. As a result, stocks with very similar betas may have wildly different price patterns because a small return mismatch can grow significantly over time. Even if beta is a good measure of risk, we still have not answered a much more important question: Where did that original misguided idea that you get higher returns by taking on more risk come from? A mathematical model for risk As it turns out, beta is a critical factor in the Capital Asset Pricing Model (or CAPM for short). This is an economic model which spells out the relationship between risk and expected returns. When it was introduced back in the 1960s it was heralded as such an incredible breakthrough for investing that some of those involved were awarded the Nobel Memorial Prize in Economics. But although it sounds impressive, the idea behind CAPM is actually fairly simple: It says that a stock's return should be equal to the risk-free rate of return, plus beta times the market's risk premium. Okay. So we've already encountered beta, but what are 'risk-free rates' and 'market risk premiums'? It turns out that the risk-free rate is simply the return generated by a perfectly safe investment. In practice, the yield on short-term U.S. treasury bills is used as a proxy for the risk-free rate. (U.S. treasury bills really aren't entirely risk free, but let's leave that aside for now.) And the market's risk premium is simply an estimate of how much more the stock market will return than the risk-free rate. It's the premium demanded by investors to hold risky stocks. In practice it is often determined from historical stock market returns or via analyst estimates. (The notion that the market must yield a positive risk premium at all times is also weak, but again I'm getting ahead of myself.) Still with me? Don't worry. I can help clarify all of this by putting the CAPM into action. Let's say the risk-free rate of return is 1%, the market itself is expected to return 4 percentage points more than the risk-free rate (so the market's risk premium is 4%), and a stock has a beta of 1.5, which makes it more risky than the market. (You can easily look up a stock's beta at either Yahoo.com or GlobeInvestor.com.) To calculate the stock's expected return according to the CAPM, you just multiply beta by the market's risk premium (1.5 x 4% = 6%), then add the risk-free rate of return (1%) for a total of 7%. Simple, right? It all comes back to beta As you can see, once you have the risk-free rate and estimated the market's excess return, then all that matters is beta. If you want high returns, you throw together a portfolio with a high beta. Or, you can skip buying individual stocks altogether and just buy the market (say via an index fund) and vary the overall risk level by adding risk-free bonds. As a result, you can dial your risk level from a beta of 0, for an all risk-free bond portfolio, to 1, for an all stock market portfolio, and even pump that beta higher if you borrow money to invest. As a mathematically minded fellow, I felt an affinity for the theory. But I quickly soured on it. Problem is, the CAPM relies on more than half a dozen key assumptions that are often routinely violated in practice. It's a theory that only works in an idealised world envisioned by day-dreaming theoreticians. Which is why, eventually, one simple graph brought the whole edifice down. (I've reproduced below.) The graph plots the returns of various portfolios versus beta. It is based on the seminal 1992 paper The Cross-Section of Expected Returns by Eugene Fama and Kenneth French. In it, they looked at the market from 1963 to 1990 and followed 10 portfolios formed by sorting stocks by beta each year and splitting the list into equal groups. Each portfolio was held for a year and then reformed. If the CAPM held true, the higher beta portfolios should yield higher returns. 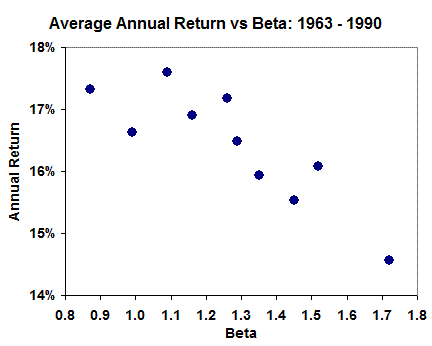
However, the trend seen in the graph is quite different. Instead of higher returns, the high-beta portfolios disappointed. Indeed, you'd have been better off by investing in the lower beta portfolios. A broken model persists As you might imagine, that comes as pretty bad news for the Capital Asset Pricing Model. Yet, despite failing to describe the real world, the theory remains surprisingly popular. Indeed, it continues to be taught in Universities and both the concept of beta and the CAPM are still widely used by financial practitioners today. Mind you, right from the outset beta had some big problems. After all, using one number to measure all of the risks in the world belies common sense. When you consider that beta is routinely calculated by looking at a stock's price history over the last few years, it's clear that it is the very definition of a rear-view mirror measure. Rear-view mirror investing in general suffers from what I'll call the British Petroleum problem. Let's say that everything was going well for a company, but one Saturday the firm's oil well blew up and oil started to spew into the ocean. Its beta, measured before the spill, probably didn't fully incorporate the chance, or magnitude, of such a disaster. On reflection, it shouldn't come as a surprise that risk often goes unrewarded. Lotteries are an excellent case in point. While being a popular diversion, most lotteries only pay out about 50% of sales in prizes which makes them a money losing proposition for most. Yet, despite being risky - you're likely to lose 50% of your money - you don't hear many financial advisors suggesting that you load up on tickets each week. (Granted, those who recommended Nortel near the top came close.) But sensible people don't use their retirement funds to play the lotto. Betting against beta So is beta a lost cause? Not at all. It appears that you can benefit by actually avoiding high-beta stocks like the plague. On this point I turn to Eric Falkenstein and his excellent book Finding Alpha: The Search for Alpha When Risk and Return Break Down for some more recent evidence. In his book Falkenstein takes a heavy hammer to traditional risk models such as the CAPM. He also provides a slew of empirical evidence showing that taking on more risk isn't rewarded in many different fields: Not just in investing, private equity, currencies, and corporate bonds - but also in movie development, sports betting, and other non-financial areas. Much like Fama and French, Falkenstein formed stock portfolios based on beta and tracked how they performed from 1962 to 2010. But instead of dividing the universe of stocks into 10 equal groups he picked 100 stocks with the highest betas and another group of 100 with the lowest betas. He also picked 100 stocks that had betas close to 0.5, 1.0, and 1.5 respectively. (The portfolios were reformed every six months.) I've graphed the returns for those portfolios below, along with those of the S&P 500. Once again, as you can clearly see, you didn't want to be in high beta stocks which performed miserably. Even more interesting, you'd have bested the market by about 2 percentage points annually by simply opting for moderate-to-low beta stocks. Cutting out the high-beta stocks improved returns considerably and the ride was smoother. 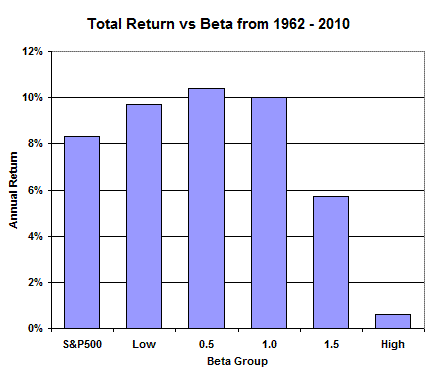
Put beta to work for you So what does all this talk of betas and CAPM mean for you as an investor? In short, that you should eschew both very risky investments and very safe investments because people tend to overpay for both. Lotto-ticket type stocks are loved too much (think of the sexy allure of technology start-ups and junior mining companies), while guarantees are too highly valued (think of the hidden high fees in guaranteed income type products). As a result, taking the middle way with a moderate amount of risk appears to hit the sweet spot in many financial markets. Indeed, moderation appears to boost both returns and well-being more generally. In a very practical way, you might soon be able to invest easily in low-beta stocks (and low-volatility stocks) via new exchange traded funds. Keep an eye out for the PowerShares S&P 500 Low Beta and Low Volatility ETFs which filled preliminary prospectuses in October 2010 and may start trading shortly. But the initial details are a little light, so be sure to do a thorough review before investing. Until then, think twice before dialling up risk. The less volatile route is likely better. That way, when a mob of disgruntled locals torches your castle you'll have the funds to rebuild on a nice tropical island. But be warned - a volcano might cost extra. + First Published: MoneySense magazine, February 2011 |
|||||
| |||||
| Disclaimers: Consult with a qualified investment adviser before trading. Past performance is a poor indicator of future performance. The information on this site, and in its related newsletters, is not intended to be, nor does it constitute, financial advice or recommendations. The information on this site is in no way guaranteed for completeness, accuracy or in any other way. More... | |||||