Stingy Investor Search - Contact - Subscribe - Login
  Home | Articles | Links | SNW
 
A time-honoured investing theory collides with new facts

Everyone agrees that investing strategies should be based on long-term evidence, not just a year or two of results.

Here's the problem, though. What happens if a new batch of data happens to disagree with decades of prior research?

James O'Shaughnessy, a U.S. money manager and financial researcher, regularly publishes new editions of What Works on Wall Street, his mammoth and illuminating tome on by-the-numbers investing strategies.

In the earlier editions of his book, it was clear that buying stocks with low price-to-book values was a winning strategy. Looking at results from 1951 to 2003, stocks with low price-to-book (P/B) ratios handily outperformed high-P/B stocks.

But Mr. O'Shaughnessy recently came out with the fourth edition of What Works on Wall Street and now the case for a low-P/B strategy is far less clear cut. Why? Because he added new data to the analysis to account for recent developments and, even more significantly, the distant past.

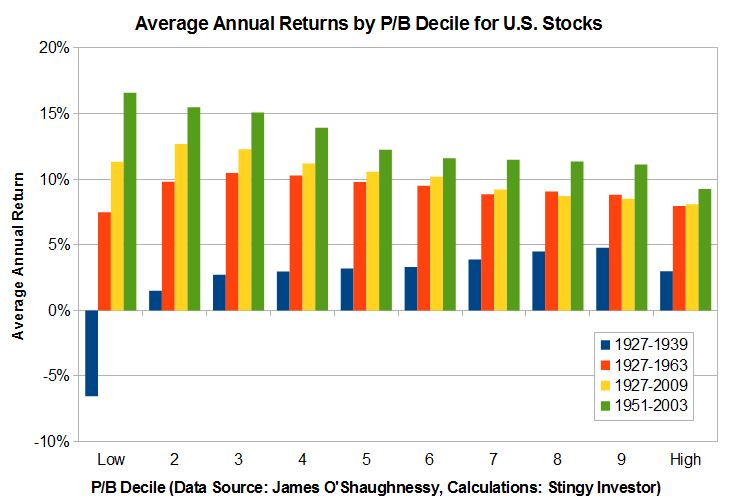
In Mr. O.Shaughnessy's studies, he sorts U.S. stocks by P/B, separates them into 10 equal groups called deciles, tracks them for a year, and then repeats the process. The results are shown in the accompanying bar chart for four different periods.

P/B decile returns for U.S. stocks
[larger version]


Recall that the third edition of Mr. O.Shaughnessy's book looked at the data from 1951 to 2003. The three series starting in 1927 come from the latest edition of the book. As a result, we get to see the impact of two of the biggest bear markets since the late 1920s - those of 1929 and 2008.

Factoring in the 1929 crash, and subsequent Depression, makes a big difference to the long-term record of low P/B stocks. During the Dirty Thirties, these apparently cheap stocks produced miserable returns.

Imagine you started doing P/B analysis in the early 1940s and saw the pattern of returns from 1927 to 1939. You would likely have avoided low-P/B stocks like the plague.

The situation remained poor even during the much longer period from 1927 to 1963, just before growth investing and the Nifty Fifty became all the rage. In this case, the lowest-P/B decile lagged the average stock by just over 2 percentage points annually.

The lowest decile of P/B stocks eventually became a strong contender over the very long-term. It is also important to point out that low-P/B stocks have performed quite well since the 1930s. Indeed, the strong performance record of the recently departed Walter Schloss, a value investing legend, stands as a testament to the gains of such stocks in recent decades.

But it makes one wonder just how long the long-term should be when studying stocks. Even the 50 years from 1951 to 2003 weren't sufficient to suss out the weakness in the lowest decile of P/B stocks. More trouble might be revealed if the numbers are tracked back another 25 years - or followed forward for another 25. The moral here? Investors should strive to find evidence that disconfirms their theories.

First published in the Globe and Mail, February 25 2012.

 
Globe & Mail Articles
 Portfolios

 Dividend All-Stars for 2024
 250 Megastars for 2024
 Extreme yields
 The easy way
 Smaller stable dividend
 250 Megastars for 2023
 Champagne portfolio
 Screaming Value
 Blended momentum
 Dividend monster
 Frugal dividend
 Stable dividend
 Speads and recessions
 TSX 60 for value investors
 Looking at 10-year returns
 Watching for a bottom
 Oh, bother!
 Low P/E DJIA
 Indexing advice
 Media-shy stocks
 Curse of size
 Market uncertainty
 Be even lazier
 Scary beats safe
 Small, illiquid, value
 Use the numbers
 What value is good value?
 Sculpt for value
 Value vs CAPE
 Graham Rules
 CAPE vs PeakE
 Top value ratio
 Low Beta
 Value and dividends
 Walter Schloss
 Try unloved AIG
 Why I'm a value investor
 New world of ETFs
 Low P/Es possible
 10 yielders
 Be happier
 Long-Short
 Dividend Downside
 Shiller's P/E
 Copycat investing
 Cashing in on class
 Index roulette
 Theory collides
 Diving too deep
 3 retirement villains
 Scourge of inflation
 Economic omens
 Analyst Expectations
 Value stock scarcity
 It's all in the index
 How to pick good funds
 Low Beta Wins
 Hunt for dividend stocks
 Think garage sale

MoneySaver Articles
 2 Graham Stocks for 2018
 2 Stingy Stocks for 2017
 2 Graham Stocks for 2017
 3 Stingy Stocks for 2016
 5 Graham Stocks for 2016
 3 Stingy Stocks for 2015
 3 Graham Stocks for 2015
 3 Stingy Stocks for 2014
 4 Graham Stocks for 2014
 8 Stingy Stocks for 2013
 6 Graham Stocks for 2013
 9 Stingy Stocks for 2012
 8 Graham Stocks for 2012
 Simple Way 2011
 5 Stingy Stocks for 2011
 7 Graham Stocks for 2011
 Simple Way 2010
 5 Stingy Stocks for 2010
 8 Graham Stocks for 2010
 Simple Way 2009
 Timing Temptation
 19 Stingy Stocks for 2009
 4 Graham Stocks for 2009
 Simple Way 2008
 Active at Passive Prices
 Unbundling ETFs 2008
 5 Stingy Stocks for 2008
 5 Graham Stocks for 2008
 Is your index too active?
 Graham's Simple Way
 Canadian Graham Stocks
 5 Stingy Stocks for 2007
 8 Graham Stocks for 2007
 Top SPPs
 The Simple Way
 A hole in your IPO?
 Monkey Business
 8 Stingy Stocks for 2006
 Graham Stock Gainers
 Blue-Chip Blues
 Are Dividends Safe?
 SPPs for 2005
 Graham's Simplest Way
 Selling Graham Stocks
 RRSP Money Market Funds
 Stingy Stocks for 2005
 High Performance Graham
 Intelligent Indexing
 Unbundling Canadian ETFs
 A history of yield
 A Dynamic Duo
 Canadian Graham Stock
 Dividends at Risk
 Thrifty Value Stocks
 Stocks in Short Supply
 The New Dividend
 Hunting Goodwill
 SPPs for 2003
 RRSP: don't panic
 Desirable Dividends
 Stingy Selections 2003
 10 Graham Picks
 Growth Eh?
 Timing Disaster
 Dangerous Diversification
 The Coffee Can Portfolio
 Down with the dogs
 Stingy Selections
 Frugal Funds
 Graham Revisited
 Just Spend It
 Ticker Temptation
 Stock Mortality
 Focus on Fees
 SPPs for the Long Term
 Seeking Solid Stocks
 Relative Strength
 The VR Approach
 The Irrational Investor
 Value Investing

Old MS Articles
 Cdn Top 200 2018
 Cdn Top 200 2017
 Cdn Top 200 2016
 Cdn Top 200 2015
 Cdn Top 200 2014
 Cdn Top 200 2013
 Cdn Top 200 2012
 Cdn Top 200 2011
 Cdn Top 200 2010
 Cdn Top 200 2009
 Cdn Top 200 2008
 Cdn Top 200 2007
 Cdn Top 200 2006
 Cdn Top 200 2005
 US Top 500 2018
 US Top 500 2017
 US Top 500 2016
 US Top 500 2015
 US Top 500 2014
 US Top 500 2013
 US Top 500 2012
 US Top 500 2011
 US Top 500 2010
 US Top 500 2009
 US Top 500 2008
 US Top 500 2007
 US Top 1000 2006
 Dividends 100 2017
 Dividends 100 2016
 Retirement 100 2015
 Retirement 100 2014
 Retirement 100 2013
 Retirement 100 2012
 Retirement 100 2011
 Retirement 100 2010
 Income 100 2009
 Income 100 2008
 Income 100 2007
 Top Trusts 2006
 Top Trusts 2005
 Hot Potato
 Buffett Buys
 FB IPO
 Stocks that pay
 Value in the S&P500
 Where to invest $100k
 Where to invest $10k
 Summer Simple Way
 A crystal ball for stocks?
 Cheap & safe
 Risky business
 Dividend investing
 Value investing
 Momentum investing
 Low P/E P/B
 Dividends
 Dividend growers
 Graham's prescription
 The case for optimism
 Wicked investments
 Simply spectacular
 Small stocks, big profits
 Value that sizzles
 So simple it works
 No assembly required
 Investing by the book
 Invest like the masters
 A simple way to get rich
 Stocks for cannibals
 Car bites dogs
 So easy, so profitable
 Dogs of the Dow
 Money for nothing
 Yield of dreams
 Return of the master

Advisor's Edge Articles
 Passive Rebundling
 Doing the math

Flip Books


About Us | Legal | Contact Us
Disclaimers: Consult with a qualified investment adviser before trading. Past performance is a poor indicator of future performance. The information on this site, and in its related newsletters, is not intended to be, nor does it constitute, financial advice or recommendations. The information on this site is in no way guaranteed for completeness, accuracy or in any other way. More...