Stingy Investor Search - Contact - Subscribe - Login
  Home | Articles | Links | SNW
 
The scourge of inflation

Inflation is the silent killer of retirement dreams. It sneaks in over the years and nibbles away at nest eggs, leaving people poorer than they once thought.

How does it do the dastardly deed? By reducing the purchasing power of money over time.

You can see its impact in the rising prices of many goods and services over the past few decades. A generation ago you might have been able to buy a nice home for $50,000; the same house today might set you back $250,000.

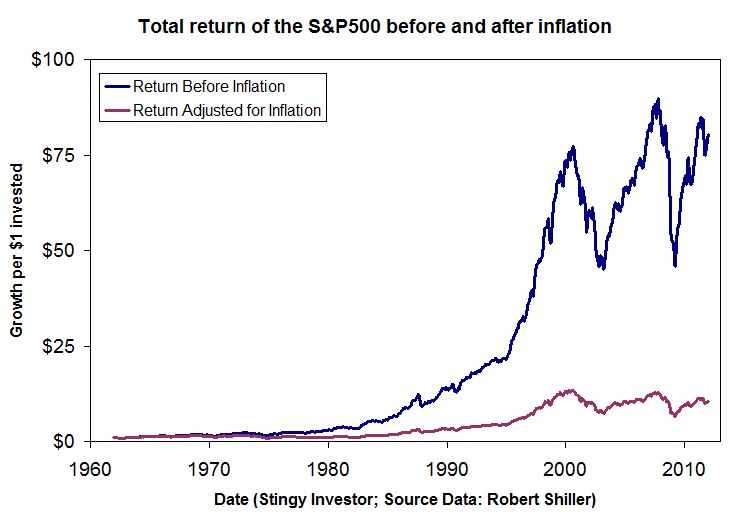
To see the bite inflation can take out of your retirement plans, let's start with the happy picture you may have spotted at your financial advisor's office. It's the graph showing the long-term returns of the S&P500.

Sure the index bounces around, but the overall picture, as depicted in the accompanying graph, is mighty impressive. The index managed an average total return of 9.2 per cent a year since the early 1960s, which sounds more than big enough to satisfy most investors.

Graph of the nominal and real returns of the S&P500
[larger version]


But that figure doesn't account for the impact of inflation. After that sneak thief had his way, the return pattern follows the much lower line on the graph. Your inflation-adjusted return would have amounted to an average of only 4.8 per cent a year.

If you hadn't properly adjusted for inflation, you might have spent too much early in retirement based on the high dollar returns and been left with too little purchasing power later on.

Inflation doesn't work alone. It does its dirty work in combination with partners, like taxes and fees, that can take additional bites out of your results.

Start with that 9.2 per cent return, take out a 2 per cent fee for the management of your mutual funds, pay a quarter of the gains in tax, and then see inflation run at 4.1 per cent and you're left with a return of about 1.3 per cent. That's not much to live on despite the market's very good return before all of these factors are taken into account.

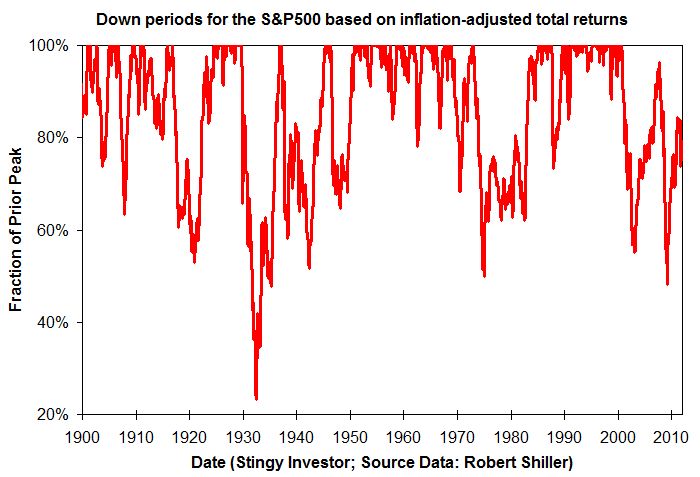
Even worse, the market can go into prolonged swoons, where inflation-adjusted returns fall below even these modest levels. Since the S&P 500 peaked in 2000, returns have actually been negative. There are also other similarly long periods when the index declined in value after adjusting for inflation.

You can see the sorry history in the accompanying graph which shows declines in the inflation-adjusted index from its prior peak level. While we are now in one such period, the 1970s and the 1930s weren't much fun either.

If the current downturn persists for a few more months, it will eclipse the 1973 to 1985 malaise in duration. Is it any wonder that more and more people are postponing their retirement these days?

Graph of the nominal and real returns of the S&P500
[larger version]


First published in the Globe and Mail, January 14 2012.

 
Globe & Mail Articles
 Portfolios

 Dividend All-Stars for 2024
 250 Megastars for 2024
 Extreme yields
 The easy way
 Smaller stable dividend
 250 Megastars for 2023
 Champagne portfolio
 Screaming Value
 Blended momentum
 Dividend monster
 Frugal dividend
 Stable dividend
 Speads and recessions
 TSX 60 for value investors
 Looking at 10-year returns
 Watching for a bottom
 Oh, bother!
 Low P/E DJIA
 Indexing advice
 Media-shy stocks
 Curse of size
 Market uncertainty
 Be even lazier
 Scary beats safe
 Small, illiquid, value
 Use the numbers
 What value is good value?
 Sculpt for value
 Value vs CAPE
 Graham Rules
 CAPE vs PeakE
 Top value ratio
 Low Beta
 Value and dividends
 Walter Schloss
 Try unloved AIG
 Why I'm a value investor
 New world of ETFs
 Low P/Es possible
 10 yielders
 Be happier
 Long-Short
 Dividend Downside
 Shiller's P/E
 Copycat investing
 Cashing in on class
 Index roulette
 Theory collides
 Diving too deep
 3 retirement villains
 Scourge of inflation
 Economic omens
 Analyst Expectations
 Value stock scarcity
 It's all in the index
 How to pick good funds
 Low Beta Wins
 Hunt for dividend stocks
 Think garage sale

MoneySaver Articles
 2 Graham Stocks for 2018
 2 Stingy Stocks for 2017
 2 Graham Stocks for 2017
 3 Stingy Stocks for 2016
 5 Graham Stocks for 2016
 3 Stingy Stocks for 2015
 3 Graham Stocks for 2015
 3 Stingy Stocks for 2014
 4 Graham Stocks for 2014
 8 Stingy Stocks for 2013
 6 Graham Stocks for 2013
 9 Stingy Stocks for 2012
 8 Graham Stocks for 2012
 Simple Way 2011
 5 Stingy Stocks for 2011
 7 Graham Stocks for 2011
 Simple Way 2010
 5 Stingy Stocks for 2010
 8 Graham Stocks for 2010
 Simple Way 2009
 Timing Temptation
 19 Stingy Stocks for 2009
 4 Graham Stocks for 2009
 Simple Way 2008
 Active at Passive Prices
 Unbundling ETFs 2008
 5 Stingy Stocks for 2008
 5 Graham Stocks for 2008
 Is your index too active?
 Graham's Simple Way
 Canadian Graham Stocks
 5 Stingy Stocks for 2007
 8 Graham Stocks for 2007
 Top SPPs
 The Simple Way
 A hole in your IPO?
 Monkey Business
 8 Stingy Stocks for 2006
 Graham Stock Gainers
 Blue-Chip Blues
 Are Dividends Safe?
 SPPs for 2005
 Graham's Simplest Way
 Selling Graham Stocks
 RRSP Money Market Funds
 Stingy Stocks for 2005
 High Performance Graham
 Intelligent Indexing
 Unbundling Canadian ETFs
 A history of yield
 A Dynamic Duo
 Canadian Graham Stock
 Dividends at Risk
 Thrifty Value Stocks
 Stocks in Short Supply
 The New Dividend
 Hunting Goodwill
 SPPs for 2003
 RRSP: don't panic
 Desirable Dividends
 Stingy Selections 2003
 10 Graham Picks
 Growth Eh?
 Timing Disaster
 Dangerous Diversification
 The Coffee Can Portfolio
 Down with the dogs
 Stingy Selections
 Frugal Funds
 Graham Revisited
 Just Spend It
 Ticker Temptation
 Stock Mortality
 Focus on Fees
 SPPs for the Long Term
 Seeking Solid Stocks
 Relative Strength
 The VR Approach
 The Irrational Investor
 Value Investing

Old MS Articles
 Cdn Top 200 2018
 Cdn Top 200 2017
 Cdn Top 200 2016
 Cdn Top 200 2015
 Cdn Top 200 2014
 Cdn Top 200 2013
 Cdn Top 200 2012
 Cdn Top 200 2011
 Cdn Top 200 2010
 Cdn Top 200 2009
 Cdn Top 200 2008
 Cdn Top 200 2007
 Cdn Top 200 2006
 Cdn Top 200 2005
 US Top 500 2018
 US Top 500 2017
 US Top 500 2016
 US Top 500 2015
 US Top 500 2014
 US Top 500 2013
 US Top 500 2012
 US Top 500 2011
 US Top 500 2010
 US Top 500 2009
 US Top 500 2008
 US Top 500 2007
 US Top 1000 2006
 Dividends 100 2017
 Dividends 100 2016
 Retirement 100 2015
 Retirement 100 2014
 Retirement 100 2013
 Retirement 100 2012
 Retirement 100 2011
 Retirement 100 2010
 Income 100 2009
 Income 100 2008
 Income 100 2007
 Top Trusts 2006
 Top Trusts 2005
 Hot Potato
 Buffett Buys
 FB IPO
 Stocks that pay
 Value in the S&P500
 Where to invest $100k
 Where to invest $10k
 Summer Simple Way
 A crystal ball for stocks?
 Cheap & safe
 Risky business
 Dividend investing
 Value investing
 Momentum investing
 Low P/E P/B
 Dividends
 Dividend growers
 Graham's prescription
 The case for optimism
 Wicked investments
 Simply spectacular
 Small stocks, big profits
 Value that sizzles
 So simple it works
 No assembly required
 Investing by the book
 Invest like the masters
 A simple way to get rich
 Stocks for cannibals
 Car bites dogs
 So easy, so profitable
 Dogs of the Dow
 Money for nothing
 Yield of dreams
 Return of the master

Advisor's Edge Articles
 Passive Rebundling
 Doing the math

Flip Books


About Us | Legal | Contact Us
Disclaimers: Consult with a qualified investment adviser before trading. Past performance is a poor indicator of future performance. The information on this site, and in its related newsletters, is not intended to be, nor does it constitute, financial advice or recommendations. The information on this site is in no way guaranteed for completeness, accuracy or in any other way. More...