Stingy Investor Search - Contact - Subscribe - Login
  Home | Articles | Links | SNW
 
The reward for today's investor?

Many stock market indicators are about as useful as cracked crystal balls. But Robert Shiller, a professor of economics at Yale University, advocates one forecasting tool that has demonstrated a modicum of predictive power over the long term.

At first glance his favoured indicator looks a lot like the familiar price-to-earnings ratio. But while the standard P/E formula divides a stock's price by its earnings per share over the last year, Prof. Shiller's method divides the stock's price by its average inflation-adjusted annual earnings over the last 10 years. He calls the result a cyclically adjusted P/E ratio, or CAPE.

In contrast to a standard P/E ratio, CAPE gives you a much better picture of how prices stack up against a stock's typical earnings power. It smooths out temporary gains or losses. This can be vital in cases where profits jump around a lot from year to year.

Take U.S. banks as an example. They were gushing profits during the real estate boom of the mid-2000s but then lost vast sums of money in the crash of 2008. It would have been wrong to extrapolate either the boom-time profits or the recessionary red ink.

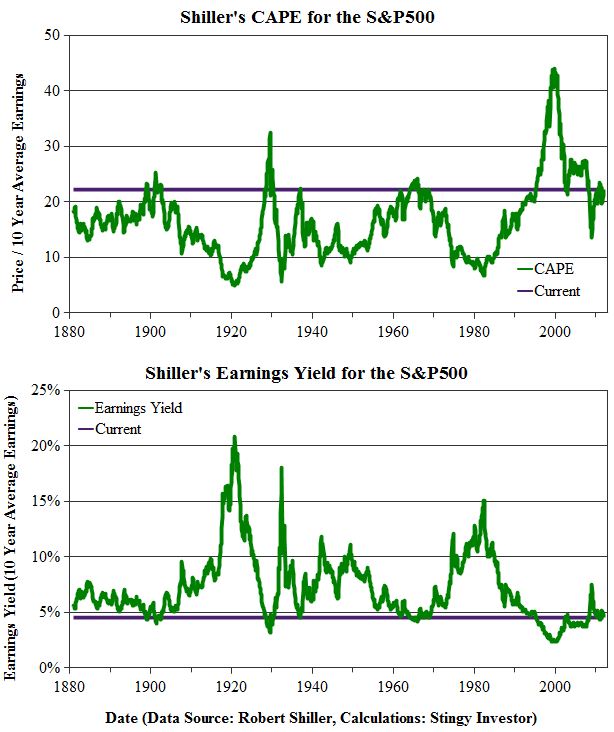
CAPE is particularly interesting when you apply it to the entire market. Prof. Shiller's CAPE for the S&P 500 is shown in the accompanying graph. The horizontal line on the graph highlights the market's current CAPE of 22.1. As you can see, that's quite high compared to the median level of 15.8 and suggests the market is overvalued.

Shiller's P/E
[larger version]


You can view the same data another way. The market's earnings yield is its earnings expressed as a percentage of its price. It's the number of pennies of profit for every dollar you invest. You can think of the earnings yield as the mirror image of the standard P/E ratio, but earnings yields tend to be more intuitive because they are quoted in percentages just like interest rates or dividend yields.

The second graph displays Prof. Shiller's earnings yield (again using 10-year average earnings) for the S&P 500. It shows the current earnings yield of 4.5 per cent is far below the historical median of 6.3 per cent.

Both graphs buttress the notion that the S&P 500 is expensive today. That's good news for investors looking to sell but not so happy news for buyers. If Prof. Shiller's earnings yield suddenly moved back to its long-term median level then the market would drop by almost 30 per cent.

History suggests that long-term returns are likely to be meagre for those buying in at today's prices. Previous periods when earnings yields were between 4 per cent and 5 per cent produced average annual returns (adjusted for inflation and including reinvested dividends) of a mere 2.6 per cent over the subsequent 10 years.

If history repeats itself, today's investors have little margin of safety. In a market like this, it's important for investors to keep management fees and taxes to a minimum because reducing such levies are likely to mean the difference between long-term gains and losses.

First published in the Globe and Mail, April 7 2012.

 
Globe & Mail Articles
 Portfolios

 Dividend All-Stars for 2024
 250 Megastars for 2024
 Extreme yields
 The easy way
 Smaller stable dividend
 250 Megastars for 2023
 Champagne portfolio
 Screaming Value
 Blended momentum
 Dividend monster
 Frugal dividend
 Stable dividend
 Speads and recessions
 TSX 60 for value investors
 Looking at 10-year returns
 Watching for a bottom
 Oh, bother!
 Low P/E DJIA
 Indexing advice
 Media-shy stocks
 Curse of size
 Market uncertainty
 Be even lazier
 Scary beats safe
 Small, illiquid, value
 Use the numbers
 What value is good value?
 Sculpt for value
 Value vs CAPE
 Graham Rules
 CAPE vs PeakE
 Top value ratio
 Low Beta
 Value and dividends
 Walter Schloss
 Try unloved AIG
 Why I'm a value investor
 New world of ETFs
 Low P/Es possible
 10 yielders
 Be happier
 Long-Short
 Dividend Downside
 Shiller's P/E
 Copycat investing
 Cashing in on class
 Index roulette
 Theory collides
 Diving too deep
 3 retirement villains
 Scourge of inflation
 Economic omens
 Analyst Expectations
 Value stock scarcity
 It's all in the index
 How to pick good funds
 Low Beta Wins
 Hunt for dividend stocks
 Think garage sale

MoneySaver Articles
 2 Graham Stocks for 2018
 2 Stingy Stocks for 2017
 2 Graham Stocks for 2017
 3 Stingy Stocks for 2016
 5 Graham Stocks for 2016
 3 Stingy Stocks for 2015
 3 Graham Stocks for 2015
 3 Stingy Stocks for 2014
 4 Graham Stocks for 2014
 8 Stingy Stocks for 2013
 6 Graham Stocks for 2013
 9 Stingy Stocks for 2012
 8 Graham Stocks for 2012
 Simple Way 2011
 5 Stingy Stocks for 2011
 7 Graham Stocks for 2011
 Simple Way 2010
 5 Stingy Stocks for 2010
 8 Graham Stocks for 2010
 Simple Way 2009
 Timing Temptation
 19 Stingy Stocks for 2009
 4 Graham Stocks for 2009
 Simple Way 2008
 Active at Passive Prices
 Unbundling ETFs 2008
 5 Stingy Stocks for 2008
 5 Graham Stocks for 2008
 Is your index too active?
 Graham's Simple Way
 Canadian Graham Stocks
 5 Stingy Stocks for 2007
 8 Graham Stocks for 2007
 Top SPPs
 The Simple Way
 A hole in your IPO?
 Monkey Business
 8 Stingy Stocks for 2006
 Graham Stock Gainers
 Blue-Chip Blues
 Are Dividends Safe?
 SPPs for 2005
 Graham's Simplest Way
 Selling Graham Stocks
 RRSP Money Market Funds
 Stingy Stocks for 2005
 High Performance Graham
 Intelligent Indexing
 Unbundling Canadian ETFs
 A history of yield
 A Dynamic Duo
 Canadian Graham Stock
 Dividends at Risk
 Thrifty Value Stocks
 Stocks in Short Supply
 The New Dividend
 Hunting Goodwill
 SPPs for 2003
 RRSP: don't panic
 Desirable Dividends
 Stingy Selections 2003
 10 Graham Picks
 Growth Eh?
 Timing Disaster
 Dangerous Diversification
 The Coffee Can Portfolio
 Down with the dogs
 Stingy Selections
 Frugal Funds
 Graham Revisited
 Just Spend It
 Ticker Temptation
 Stock Mortality
 Focus on Fees
 SPPs for the Long Term
 Seeking Solid Stocks
 Relative Strength
 The VR Approach
 The Irrational Investor
 Value Investing

Old MS Articles
 Cdn Top 200 2018
 Cdn Top 200 2017
 Cdn Top 200 2016
 Cdn Top 200 2015
 Cdn Top 200 2014
 Cdn Top 200 2013
 Cdn Top 200 2012
 Cdn Top 200 2011
 Cdn Top 200 2010
 Cdn Top 200 2009
 Cdn Top 200 2008
 Cdn Top 200 2007
 Cdn Top 200 2006
 Cdn Top 200 2005
 US Top 500 2018
 US Top 500 2017
 US Top 500 2016
 US Top 500 2015
 US Top 500 2014
 US Top 500 2013
 US Top 500 2012
 US Top 500 2011
 US Top 500 2010
 US Top 500 2009
 US Top 500 2008
 US Top 500 2007
 US Top 1000 2006
 Dividends 100 2017
 Dividends 100 2016
 Retirement 100 2015
 Retirement 100 2014
 Retirement 100 2013
 Retirement 100 2012
 Retirement 100 2011
 Retirement 100 2010
 Income 100 2009
 Income 100 2008
 Income 100 2007
 Top Trusts 2006
 Top Trusts 2005
 Hot Potato
 Buffett Buys
 FB IPO
 Stocks that pay
 Value in the S&P500
 Where to invest $100k
 Where to invest $10k
 Summer Simple Way
 A crystal ball for stocks?
 Cheap & safe
 Risky business
 Dividend investing
 Value investing
 Momentum investing
 Low P/E P/B
 Dividends
 Dividend growers
 Graham's prescription
 The case for optimism
 Wicked investments
 Simply spectacular
 Small stocks, big profits
 Value that sizzles
 So simple it works
 No assembly required
 Investing by the book
 Invest like the masters
 A simple way to get rich
 Stocks for cannibals
 Car bites dogs
 So easy, so profitable
 Dogs of the Dow
 Money for nothing
 Yield of dreams
 Return of the master

Advisor's Edge Articles
 Passive Rebundling
 Doing the math

Flip Books


About Us | Legal | Contact Us
Disclaimers: Consult with a qualified investment adviser before trading. Past performance is a poor indicator of future performance. The information on this site, and in its related newsletters, is not intended to be, nor does it constitute, financial advice or recommendations. The information on this site is in no way guaranteed for completeness, accuracy or in any other way. More...