|
|||||||||||||||||||||||||||||||||||||||||||||||||||||||||||||||||||||||||||||||||||||||||||||||||||||||||||||||||||||||||||||||||||||||||||||||||||||||
|
|||||||||||||||||||||||||||||||||||||||||||||||||||||||||||||||||||||||||||||||||||||||||||||||||||||||||||||||||||||||||||||||||||||||||||||||||||||||
|
Investing: The case for optimism It's all in the phone calls. As a financial consultant and writer, that's how I measure the level of fear in the market. As share prices crashed this past year it wasn't the panicky calls from colleagues that surprised me. It was the calls from old high school chums and distant relatives that got me thinking. Hearing from people who normally don't care about the markets struck me as a sure sign that the fear-o-meter was off the charts. So I started buying stocks. I'm buying because I know that fear and panic are recurring, but temporary, features of Bay Street and Wall Street. I'm confident that the current mess, both in the markets and in the economy, will eventually clear. Recovery may take a while, but just as good times inevitably come to an end, so do bad times. And when the current crisis eases, I expect my current purchases to do very well. I'm not trying to brush off the pain that many investors are feeling today - U.S. and Canadian stocks are down about 41% from their respective peaks. I can sympathize with anyone who has seen the value of their investments chopped nearly in half. There might even be more suffering ahead before the market turns decisively upward. But let's put the decline into context. The current downturn is big, but not unprecedented - in fact, based on monthly data, it's only the fourth worst market slide since 1876. History suggests that bear markets tend to recover relatively quickly. U.S. markets typically recover all their losses within 31 months after hitting bottom. (The historical data, which includes reinvested dividends, are based on month-end figures for the S&P 500 and its predecessor indexes produced by Robert Shiller, a professor of economics at Yale.)
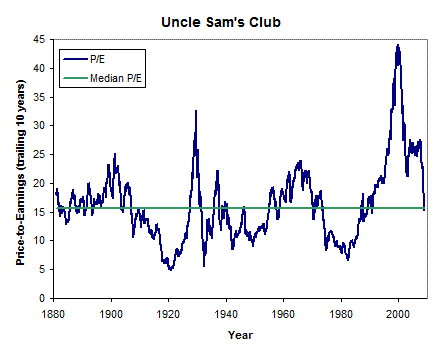
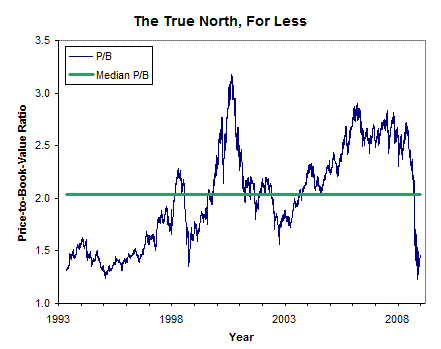
How bad can things get? The great crash of 1929 saw U.S. stocks slide 83% over 33 months. Even more depressing, it took until 1945 for them to climb back to their former levels. There is a slim (I think very slim) chance that the current downturn may rival that record, so it is wise to make sure that you can survive further declines should they occur. But for the most part the historical record gives us more reason for optimism than pessimism. The greatest reason for optimism is that stocks are now offering some of the best values in more than a decade. Many quality companies are available at sharp discounts. Second-tier firms are going for a song. Charlie Munger, the U.S. billionaire, says, 'Price is what you pay, value is what you get.' The value indicators I see say that this is the best time to buy since the early 1990s. One good measuring tool is the trailing 10-year P/E ratio on the S&P 500 index of large U.S. stocks. This ratio works much like a regular price-to-earnings ratio, but instead of comparing a company's stock price to its earnings over the past 12 months, it compares the firm's stock price to its average earnings over the past 10 years. By looking at 10-year average earnings, rather than just the past year, you smooth out the ups and downs of the business cycle. The 10-year P/E ratio is now below its median level. This indicates that for the first time since the early 1990s, U.S. stocks are no longer wildly overpriced. Instead, they offer fair value and should produce profits in keeping with the stock market's long-term record. That means it's reasonable to expect returns approaching 10% a year, or more, from stocks over the next decade or so.  Canadian companies also appear to be on sale. You can see this if you look at the Canadian stock market's price-to-book value ratio. Book value is the amount of money that you would obtain if you could sell off all of a company's assets (at their balance sheet values) and pay off all of its debts. Most of the time stocks trade at a premium price compared to their book value because they're worth more alive than liquidated. Today, that price-to-book-value premium is much reduced. I only have data for a comparatively short period, but the numbers show the S&P/TSX composite is less expensive than it has been in more than a decade.  I acknowledge that you can interpret my charts in a couple of ways. While stocks are now at fair levels, you can see that they've been even better bargains at several points in the past. So, yes, there is a possibility that stocks could fall further and you should be prepared for that eventuality. The dilemma is, should we take a chance and hope for even better bargains ahead, or accept the pretty good deals that are already on offer? There's a fellow in Omaha who recently spoke to that question. His name is Warren Buffett and he is very optimistic. In October, he wrote an article for The New York Times called 'Buy American. I Am.' Buffett declared that he was moving his personal portfolio from government bonds to stocks and expected to soon be fully invested in U.S. stocks. 'A simple rule dictates my buying,' Buffett wrote. 'Be fearful when others are greedy, and be greedy when others are fearful...I haven't the faintest idea as to whether stocks will be higher or lower a month - or a year - from now. What is likely, however, is that the market will move higher, perhaps substantially so, well before either sentiment or the economy turns up. So if you wait for the robins, spring will be over.' Buffett doesn't often make public calls on the stock market, but the billionaire's past pronouncements have been very profitable. He was a vocal advocate of buying stocks at a couple of points in the 1970s; then, at the height of the tech bubble in 1999, he went public to warn people away from stocks. You would have done well to listen to the Oracle of Omaha. Like Buffett, I expect stock market returns over the longer term to be quite satisfactory. I think now is a good time to put some money to work.
I can hear your protests from here. If you're having difficulty grappling with the notion of pouring more spare cash into the stock market after the disaster of the past year, I sympathize with how you feel. But you should remind yourself that emotions often lead us astray, particularly when it comes to the stock market. No matter what you decide to do over the next few months, you can take away a profitable lesson from this crisis if you realize that it is important to break away from the herd when it is stampeding over a cliff. Most investors sabotage their results by buying after long periods of prosperity when the market is at a high, and selling - or at least, refusing to invest - after periods of hardship when the market is significantly down. This habit of buying high and selling low means most investors do much worse than the overall market. Consider the Vanguard Total Stock Market Index Fund. This index fund posted average losses of 0.7% a year for the 10 years ending Dec. 31, 2008. However, the typical investor in the fund actually lost 3.7% a year over the same period, according to morningstar.com. The difference - a whopping three percentage points a year - is the result of investors jumping in and out of the fund at bad times. Similar results have been found by numerous studies that try to measure the impact of investors' timing on their portfolio results. It feels scary to invest in the market during a recession. Friends and family won't pat you on the back and reassure you that you're making the right move. But if you diversify your holdings and do your research, I think the market holds more potential now than it has for a decade. As a result, I've bought more shares in the last few months than I have over the last few years and I'm keeping some cash on hand to buy even more should further opportunities arise. I think those who buy stocks now will do well - but be honest with yourself. If you are a dyed-in-the-wool GIC investor, you probably shouldn't swap your GICs for a stock-heavy portfolio. In fact, people who don't like risk should steer clear of stocks no matter how tempting the current valuations may be. Just remember to stick to that habit the next time that a bull market is in full swing. First Published: MoneySense magazine, February 2009 |
|||||||||||||||||||||||||||||||||||||||||||||||||||||||||||||||||||||||||||||||||||||||||||||||||||||||||||||||||||||||||||||||||||||||||||||||||||||||
| |||||||||||||||||||||||||||||||||||||||||||||||||||||||||||||||||||||||||||||||||||||||||||||||||||||||||||||||||||||||||||||||||||||||||||||||||||||||
| Disclaimers: Consult with a qualified investment adviser before trading. Past performance is a poor indicator of future performance. The information on this site, and in its related newsletters, is not intended to be, nor does it constitute, financial advice or recommendations. The information on this site is in no way guaranteed for completeness, accuracy or in any other way. More... | |||||||||||||||||||||||||||||||||||||||||||||||||||||||||||||||||||||||||||||||||||||||||||||||||||||||||||||||||||||||||||||||||||||||||||||||||||||||