|
|||||||||||||||||||||||||||||||
|
|||||||||||||||||||||||||||||||
|
The Top 200 Canadian Stocks for 2015 The holidays can be a tough time for those who agonize over decisions. You have to choose the right wine for Christmas dinner, the right tree for the living room, and just the right gift for Mrs. Wright who teaches arithmetic to Junior. Picking the right stocks for your portfolio can be even more taxing. If you make the wrong choice here, the fallout could be far greater than dealing with a disappointed math teacher. That's why we're pleased to offer a helping hand with the 11th annual MoneySense Top 200 guide to Canadian stocks. It's packed with the information professional investors like to consider, as well as an easy-to-use grading system for less seasoned investors. Unlike other stock-picking systems, ours has a full decade of stellar, easily verified performance behind it. Our annual All-Star stock picks, which combine the best growth and value characteristics, have climbed by an average of 17.3% a year since we started 10 years ago. That assumes an equal dollar amount was put into each All-Star stock in first year and rolled into the new All-Stars each year thereafter. By way of comparison, the S&P/TSX Composite (as represented by the XIC ETF) advanced by just 5.3% annually over the same period. The All-Stars beat the market by an average of 12.0 percentage points per year over the last decade. The graphs below convert those percentages into more easily understandable dollar terms. If you had split $100,000 equally among the original All-Stars 10 years ago and moved into the new stocks each year, your portfolio would now be worth approximately $492,000 - almost five times your original investment. 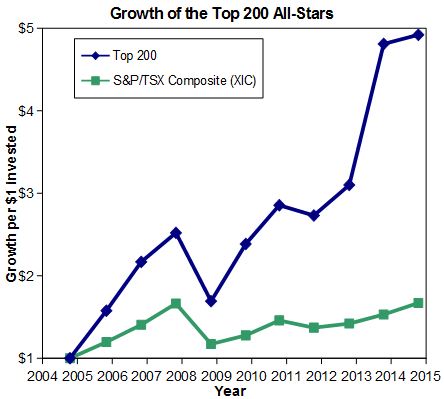 However, those wonderful average gains came with a few disappointments along the way. For instance, the All-Stars lost almost 33% from November 2007 to November 2008. They also trailed the market in three of the last 10 annual periods. As it happens, this past year has been one of the disappointing ones. While the All-Star stocks climbed 2.3% since last time, they trailed the S&P/TSX Composite ETF, which gained 9.3%. (The return figures shown above do not include dividends.) We'd love to be able to say such disappointments are a thing of the past, but seasoned investors know that every stockpicking method runs into difficulty from time to time. We fully expect the All-Stars to lag the market, or even lose money, on occasion. In addition, some individual stocks inevitably go sour. While we do our best to avoid such situations, it's just not possible to take the market's gains without experiencing its downside now and then. The Top 200 examines Canada's largest 200 companies (by revenue) using data from Bloomberg. Each firm is graded in two very different ways. First we consider its attractiveness as a value investment and then we determine its appeal as a growth investment. Our value and growth tests employ sophisticated calculations that are based strictly on the numbers. Our feelings or intuitions about a company don't enter into it. But we sum up everything about a stock in easy-to-understand grades - one for value and the other for growth. The grades work just like they did when you were in school. Top stocks get As. Solid firms are awarded with Bs or Cs. Those that don't measure up get Ds or even Fs. Stocks with good grades are deemed to be worthy of consideration while those at the bottom of the class should be treated with caution. The select group of stocks that get at least one A and one B on the value and growth tests make it into the All-Star list. Before we talk about them, let's walk through the grading process. How to measure value Value investors like solid stocks selling at low prices. That's why we look for companies with low price-to-book-value (P/B) ratios. This ratio compares a firm's market value to the amount of money that could be raised by selling off its assets (at their balance-sheet values) and paying off its debts. A low P/B ratio provides some assurance that you're not paying much more for a company than its parts are probably worth. To get top marks for value, a stock must possess a low P/B ratio compared to the market and also compared to its peers within the same industry. We also track price-to-tangible-book-value ratios. Tangible book value is like regular book value, but ignores intangible assets like goodwill. It's an even sterner test of how much a company would be worth if it had to be sold off for scrap. Assets are one thing, but it's also important to investigate each company's bottom line. We prefer profitable companies and award higher grades to firms with positive price-to-earnings (P/E) ratios (based on their earnings over the past 12 months). We also reward a company if industry analysts expect it to be profitable and have a positive P/E over the next year. (This number is known as the forward P/E ratio.) Because we know investors enjoy getting some spending money, we award extra marks to firms that pay dividends. As it happens, dividend-payers generally outperform the miserly firms that don't pay dividends. For safety's sake we also want to make sure a company hasn't loaded up on debt. That's why we award better grades to firms with low leverage ratios (defined as the ratio of assets to stockholders' equity) relative to their peers. We combine these factors into a single value grade. Only 20 out of 200 stocks got an A this year.
Grading for growth Growing firms tend to be healthier than those in decline. That's why we award higher marks to any company that has achieved reasonable earnings-per-share and sales-per-share growth over the last three years. We also track each firm's growth in total assets over the last year to get a sense of the momentum in its business. While fundamental growth is great, we also like it when the market takes notice. That's why we give higher marks to stocks with solid returns over the past year. In addition, we want to make sure that companies use their capital wisely. So we scrutinize each stock's return on equity, which measures how much a firm is earning compared to the amount shareholders have invested. Return on equity is a measure of business quality and we give high marks to those firms which outperform their peers. Since no one wants to buy an overly inflated stock, we weigh up each stock's price-to-sales ratio, which as you might expect, compares its price to its sales. We figure stocks with low-to-moderate ratios are reasonably priced while those with sky-high ratios could suddenly fall back to earth. We put these factors together to determine each stock's growth grade. Only 20 out of the 200 got an A this year.
The All-Star stocks Nine stocks made it into the All-Star list this year by earning at least one A and one B on our value and growth tests. Two of this year's top stocks, Cervus Equipment (CVL) and WestJet Airlines (WJA), were also in the All-Star team last year. Cervus runs the largest group of John Deere dealerships in Canada and has a presence in the commercial, industrial and equipment sectors. WestJet is well-known as one of the larger airlines in Canada. Fairfax Financial (FFH) is the only stock to get both an A for value and an A for growth. It's a sprawling insurance-focused conglomerate run by noted value investor Prem Watsa from its headquarters in Toronto. Much like Warren Buffett's Berkshire Hathaway (BRK.A), the firm has added noninsurance companies to its family of companies in recent times. (I own both stocks.) The other All-Stars with the best value grades are Capital Power (CPX) and Maple Leaf Foods (MFI). Those on the growth roster are Canadian Tire (CTC.A), CCL Industries (CCL.B), Cogeco (CGO), and Western Forest Products (WEF).
Before rushing out to buy any stock, do your own due diligence. Make sure its situation hasn't changed in some important way. Read the latest press releases and regulatory filings. Scan newspaper stories to make sure you're up to speed and be careful when buying or selling stocks that trade infrequently. If you take these important steps, you'll be a more comfortable - and successful - investor for years to come. First published in the December/January 2015 edition of MoneySense magazine. Added:
|
|||||||||||||||||||||||||||||||
| |||||||||||||||||||||||||||||||
| Disclaimers: Consult with a qualified investment adviser before trading. Past performance is a poor indicator of future performance. The information on this site, and in its related newsletters, is not intended to be, nor does it constitute, financial advice or recommendations. The information on this site is in no way guaranteed for completeness, accuracy or in any other way. More... | |||||||||||||||||||||||||||||||