|
|||||
|
|||||
|
A crystal ball for stocks? There's no denying the powerful allure of stock-picking strategies that promise to predict the future. The next time an investing conference comes to town, take a few hours out of your day to pay a visit and you'll see what I mean. As you wander down the aisles, you'll likely find several outfits selling expensive software designed to spot stock trends for you. It sounds so easy. All you have to do to make money is hit the buy button when the system flashes green and sell when it turns red. Why, with a little training, even Pavlov's dog could do it. Such systems usually have a few characteristics in common: They promise to make you rich, they involve lots of complicated graphs and scientific-sounding indicators, and they tend to involve frequent trading. They're also predicated on the belief that by studying where stock prices have been in the past you can - like the proverbial fortune teller with a crystal ball - predict how things will play out in the future. These strategies belong to an investing field called technical analysis (as opposed to fundamental analysis which involves looking at the financial health and valuation of the companies themselves). And they're hugely popular. After all, we humans are glorious pattern finders. It's evolutionarily useful to be able to quickly spot lions hiding in the bush - and when we do, fast action saves lives. But does it make sense to take our stone-age pattern-spotting propensity and apply it to the modern world? The surprising answer is - in some cases - yes. But you need to identify the cases where it doesn't make sense, and they are legion. When someone is trying to sell you such a Pavlovian system, you'll often find yourself dealing with a tarot card reader of the markets. Like a two-bit fortune teller at the county fair, they'll serve up a darn good yarn, but their stock analysis will usually fall flat. Why we love technical analysis At a very deep level, we're all suckers for patterns. The problem is, it's easy to stumble on erroneous patterns in large mounds of data. You can see the result on TV almost every night in the form of new medical breakthroughs. You know, titillating things like the discovery that eating yellow foods decreases the risk of having a heart attack. But after loading up on squash and turning a strange shade of pale, another study might come along that refutes the first and instead points to the cancer causing properties of yellow food. It's a wonder health-conscious people eat anything all. (Rest assured yellow foodies, these examples are fictitious.) The problem being, just because you've spotted a pattern doesn't mean that it's predictive or, in math speak, correlation does not prove causation. All too often what the researcher actually uncovered occurred simply by chance. That doesn't keep our love of predictable patterns from infiltrating the markets in all sorts of unexpected ways. Even the types of prices you see in the stock market are impacted by it, as some numbers tend to show up in share prices more often than others. For instance, in 2001, stocks on the NYSE traded most often at prices ending in 0 and second most frequently at prices ending with a 5. That is, people liked to trade in five-cent increments with $16.10 being more common than $16.05, and both being more prevalent than $16.12. Interestingly, traders in China have a slight preference for prices ending in 8, a lucky number for the Chinese, and they tend to avoid those ending in 4, which is viewed as less propitious. Most investors would say that looking for patterns in raw prices is a waste of time. But when it comes to the overall performance of the markets, it's hard to find an investor who isn't looking for patterns on some level. The past is almost always viewed as prologue, despite the common refrain that 'past performance is not an indicator of future returns.' Even buy-and-hold types often employ a mild form of technical analysis. After all, when they point to the long-term performance of the stock market as proof that it makes sense to invest in stocks, they are using pricing patterns from the past to try to predict the future. Indeed, in Canada and the U.S., which have been amongst the best places in the world for stock investors over the last century or so, it's common for regular families to have a great deal of their retirement savings in stocks. However in places like Japan, where the stock market has been mired in a grinding bear market for many decades, families tend to shy away from stocks. The technical trap Many of the purveyors of slick technical analysis strategies are well aware of our passion for patterns, and use it to peddle their systems. They'll often take a stock trend system, draw us in with their multicoloured charts, and then close the sale by pointing to spectacular past returns. But what they often don't tell you is that the stellar performance records used to advertise such services are usually generated via back testing and not by actually investing money. It can be a trick that even good investors can slip into inadvertently. If you set out to find the best stock-picking scheme by tweaking many different parameters and seeing which has worked the best in the past, you'll soon have a hyper-optimized strategy with giant past returns. But you're just data-mining fool's gold because when these schemes are put into practice, future returns usually disappoint. (Which is likely why the software offered at the trade shows seems to change from year to year.) Even when it comes to more reputable techniques, the excess returns generated by technical strategies often diminish dramatically after they've become widely known, as investors chase gains and bid up prices. This can put you in a nasty bind when a technical strategy, even if it's a valid one, starts to underperform. In a down period, which can last for several years, it becomes very hard to tell if the method still works. It's easy to come to the conclusion that the benefits of the strategy have eroded away, which, in turn, can prompt the abandonment of it at, perhaps, a very poor time. That's why I tend to personally eschew much of the technical world, but I also remain curious about some of its stronger findings. A method that works on paper Momentum investing is one technical strategy that seems to work. Imagine being able to buy into the winning group of the moment, ride it higher, and then jump to the next hot thing in a timely fashion. That's what momentum investors try to do. To help explore momentum, I turn to Richard Tortoriello's book Quantitative Strategies for Achieving Alpha. In the book he explores a wide variety of strategies but I'm going to focus on two. (Both studies look at U.S. stocks from 1987 through 2006 with market capitalizations larger than $500 million and prices in excess of $2 per share.) The first study explores the efficacy of using a stock's 52-week price range to form portfolios. The basic idea is simple. Stocks trading near their 52-week highs are favoured and are said to have positive momentum. Those trading near their 52-week lows are to be avoided and are said to have negative momentum. As Tortoriello observes, 'the gist of this strategy might be expressed more accurately as buy high and sell higher, and sell low and buy (back) lower. The strategy illustrates a truth about investing that is not widely understood: the common stock investor should buy into strength and sell (i.e. sell short) into weakness.' More specifically, Tortoriello looked at the performance of the 20% of stocks closest to their 52-week highs and the 20% closest to their 52-week lows. The positive momentum group went on to outperform by 4.3 percentage points on average over the subsequent year and the losers underperformed by 3.9 percentage points on average. That's a pretty sizeable performance kick for a simple strategy. Now you might wryly observe that these results could simply be the result of pattern matching and data mining of the sort I was warning you against just a few paragraphs earlier. Indeed, efficient market theorists would say that this is so. However, momentum has been spotted in many different markets around the world, it has persisted for many years after it was brought to the public's attention, and it has been a feature of the stock market for decades. So bear with me a little longer, and let's now have a look at using different performance periods to measure momentum. In this case, instead of using the 52-week range as our momentum measure we'll use past performance. Here positive momentum stocks are defined as the 20% group that has outperformed other stocks over a particular period whereas negative momentum stocks are the 20% with the worst relative performance. To form portfolios, each year the universe of stocks is sorted by performance, over a particular period, and the top 20% of performers are purchased in equal amounts, held for a year and then the process is repeated. (Tortoriello actually does the whole thing four times based on quarter ending dates and averages the results together.) But the key thing here is that the period used to measure performance when selecting stocks is varied. As a result, the performance of strategies based on measuring momentum over the last two months, four months, and all the way out to 80 months can be compared. Positive momentum yielded good results based on returns over the prior six months. That is, buying the 20% of stocks with the best gains over the prior six months and then holding them for a year seemed to work well with a performance boost of 3 percentage points a year. Alternately, if returns over the prior 18 months were used, you'd have underperformed. As a result, the trend might be your friend, or your enemy, depending on the time period in question. Time sensitivity is a tricky feature of many technical techniques and one that you should watch out for. The situation was largely reversed for stocks with negative momentum. Stocks that performed poorly over the last six months subsequently underperformed over the next year by 3.6 percentage points on average. Indeed, underperformance over the prior 14 months, or less, was punished with subsequent poor returns. However, over long periods the dogs do better. You'd have done well to buy stocks that had underperformed over the prior five years because holding them for a subsequent year would have yielded a performance boost of 2.9 percentage points on average. 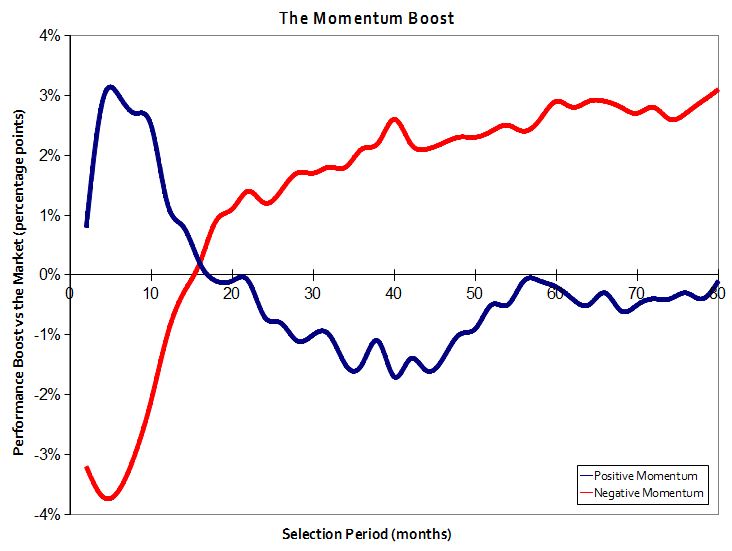 [Larger Version] Overall, Tortoriello recommends using seven-month gains to find positive momentum stocks, which provided a performance boost of 3.3 percentage points annually and a better level of consistency. Even then the ride was a wild one over the 20-year period from 1987 through 2006. The best annual gain was a marvelous 115.2%, but the worst annual loss a gigantic 66.3%. (For reference, the 52-week-range positive momentum method suffered from a comparably modest maximum annual decline of 20.2%.) But keep in mind that these figures do not factor in the 2008-09 downturn, which was a doozy that knocked many quantitative hedge funds following similar strategies out of the market. In this way, momentum might look good on paper but most investors should think twice, or thrice, before using it because periods of significant under-performance are likely, even though the long-term numbers have been good. Still, despite such failings, I think that technical analysis should be of interest to fundamentals-oriented investors. For instance, the poor subsequent performance of negative momentum stocks, like those near their 52-week lows, should raise alarm bells for value investors who often like to peruse the 52-week-low list for potential bargains. Problem is, the odds seem to be significantly against investors in this area of the market over the short term. Technical analysis suggests that value investors should wait a few quarters before buying from the 52-week-low list because they'll likely get a better deal. The reverse is also true. If you're a technical investor, consider adding other measures like valuation and profitability to your tool chest. After all, it makes little sense to trade based only on past price movements when other information is also available. But does it work in practice? I've been pretty positive on the little corner of technical investing that I've highlighted. But there are some rather significant problems with the field overall. Trading frictions represent a big challenge because they can kill many technical strategies. Here I'm primarily talking about commission and bid-ask spreads. That is, your broker charges you a commission for each trade and you have to factor the fee into your strategy. After all, if the strategy you're considering is likely to outperform by 1 percentage point, you don't want to give up your upside in commissions. Similarly, if you want to buy a stock quickly you'll have to pay a premium to do so. On the other hand, if you want to sell quickly you'll have to offer a discount to find buyers. The difference between the buy and sell prices is the spread. For large stocks that trade frequently the spread is usually modest but small stocks can have very significant spreads that can amount to many percentage points per trade. Obviously good traders will try to minimize costs when possible and they may even take advantage of those rushing to trade. While it's hard to generalize because different investors face different costs, it's common for strategies that perform well on paper to fail after trading frictions are properly accounted for. As a result, you should think carefully about fees and other costs before trading and be sure to keep track of them. But perhaps the biggest knock against technical investing is the paucity of investors who have done well following it over many years. Indeed, we have a very hard time finding technical investors with strong, verifiable, multi-year performance records. (If you're out there, please let us know.) On the other hand, it's easy to find dividend investors, or value investors, who have good long-term records. There are also a fair number who have done very well focusing on a particular industry or market niche. The relative rarity of successful technical traders is a problem apply summed up a parable used by David Dreman in his book, Contrarian Investment Strategies, which I'll paraphrase briefly. Picture walking into a casino with a red room and a green room. In the red room people are speculating with gusto and are quite excited. Across from the red room there is a green room which seems sparsely attended and dull in comparison. However, you notice that people in the glamorous red room tend to lose money over time whereas the players. piles of cash grow in the boring green room. Eager to earn some money in the green room, you go home and get your stash. But then a strange thing happens. Despite your good intentions, you're lured in by the excitement of the red room and start to play. In my experience, technical analysis, on its own, tends to pull investors toward the red room. + First Published: MoneySense magazine, April 2011 |
|||||
| |||||
| Disclaimers: Consult with a qualified investment adviser before trading. Past performance is a poor indicator of future performance. The information on this site, and in its related newsletters, is not intended to be, nor does it constitute, financial advice or recommendations. The information on this site is in no way guaranteed for completeness, accuracy or in any other way. More... | |||||